CSC 308/309 Graphical Modeling Notation
The notation presented here is a general-purpose graphical format for modeling software artifacts. The notation is general purpose in that it can be used to model both specification- and design-level artifacts. For our purposes, we use two formal textual languages for representing these artifacts. JML is used to represent requirements and specifications; Java is used to represent design and implementation. The same general-purpose graphical notation maps to both of these languages.
The notation presented here uses concepts from the Unified Modeling Language (UML). The design of UML is a collaborative effort of primarily commercial organizations, led by the Rationale Corporation. The goal for UML is to develop a standard graphical modeling notation. UML is a consolidation of concepts used in the earlier Object Modeling Technique (OMT) and Booch Diagrams.
UML has a number of features that are not used in the notation described here. In addition, UML is missing certain features, notably function and dataflow diagrams. Where a feature is available in UML, the same feature is retained here. Where UML is missing what is considered to be an important notational feature, a previously existing standard is used, in such a way as not to conflict with any existing UML features. That is, if UML has it we'll use it; if UML does not have it we'll use a standard notation that does not conflict with UML.
A complete specification of UML is available at
www.uml.org
NOTE
1.
There are also a number of UML books on the market, none of which is necessary
for this class.
2. Class Diagrams
A class diagram represents the composition and inheritance relationships between objects in a specification or classes in a design. The notation described here is largely a subset of UML, with a minor extension added. Elements of class diagrams are the following:
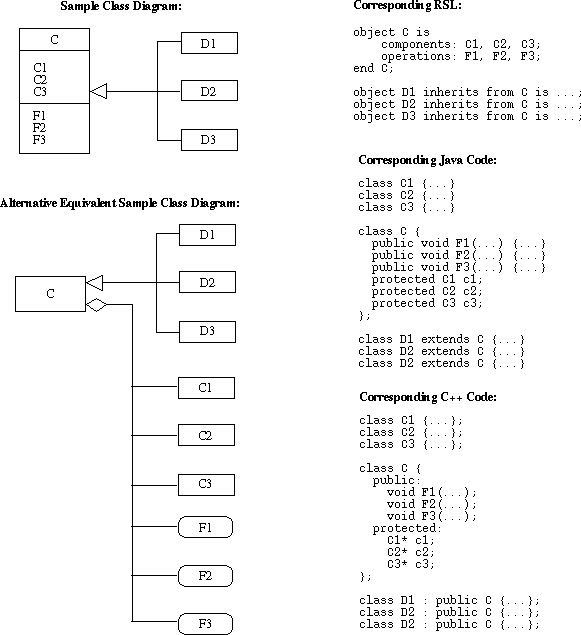
Figure 1 shows the general structure.
Figure 1: General Structure of a Class Diagram.
Orientation of components in a class diagram is not significant. That is, subclasses and members can be shown in any geometric position relative to their parent class. The orientation of the hollow triangle is significant, with the pointed end oriented towards the parent class. Also, the positioning of the hollow diamond is significant, in that it is positioned immediately adjacent to the containing class. In this way, two-way containment 2 can be depicted, as shown in Figure 2. Figure 2 also illustrates the use of multiplicity annotations.
Note that the three-part representation of membership versus the hollow diamond
representation are two equivalent views that have exactly the same meaning.
Membership can be shown in either way separately, or with the two forms
combined into a single diagram. When the two forms are used in single diagram,
there is redundant information shown -- i.e., a single diagram is showing the
same membership relationships in two different ways. The notation does not
prohibit such redundancy; it is up to the diagram designer to use the notation
as she/he sees fit.
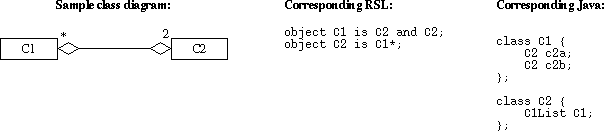
Figure 2: Two-Way Membership in a Class Diagram.
Function diagrams show the calling relationships between functions in a program design. Function diagrams are not applicable at the JML specification level. Elements of a function diagram are the following:
Figure 3 shows the general structure.
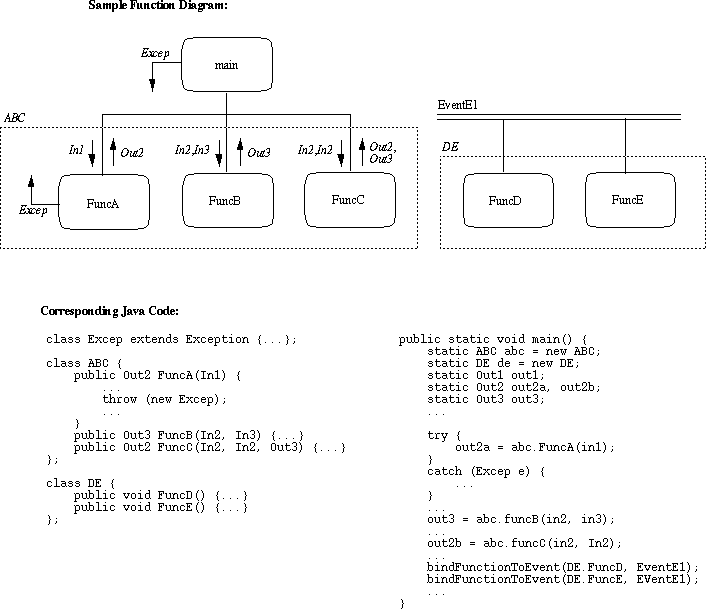
Figure 3: General Structure of a Function Diagram.
The calling relationship shown in a function diagram shows potential invocation not actual invocation. Depending on the implemented logic within a calling function, none, some, or all of its potentially called functions may actually be called during program execution.
Orientation of components in a function diagram is is significant. The root of a calling tree must be shown above or to the left of the subfunctions that it calls. Similarly, an event invocation line must be shown above or to the left of the functions that may be invoked when the event is triggered.
Strictly speaking, the left-to-right (or top-to-bottom) order of called
functions is not significant. However, by convention the left-to-right order
in a function diagram will typically be the same as the lexical order of
appearance of the functions in the Java code.
4. Package Diagrams
A package diagram is used to show grouping among related classes. A package is a modular software component containing two or more classes. Examples of packages include library, separately launchable executable programs, and other logically related collections of classes.
Elements of a package diagram are the following:
The message-passing lines abstractly represent communication in that the implementation details of the communication are abstracted out. In particular, communication can be by normal procedure call, remote procedure call, subprocess invocation, thread activation, or some other means. This level of detail is not specified in the package diagram.
Figure 4 shows the general structure of a package diagram. The diagram depicts
three packages in which Subsystem 1 calls (or otherwise invokes) Function 1 in
Subsystem 2. Subsystem 2 imports DataD1 from Subsystem 1. Subsystem
1 imports DataD2 from Subsystem 3.
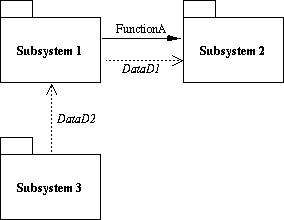
Figure 4: General Structure of a Package Diagram.
In JML and Java, packages are defined as modules and packages
respectively.
5. Discussion
The shape of a diagram node is unique across all diagrams. Furthermore, the node shape can be traced to a specific semantic construct in JML and/or Java. Viz.,
The uniqueness of shapes allows diagram elements to be combined in ways not fully supported in UML, but which is conceptually compatible with UML. In particular, the appearance of rounded rectangles in data diagrams depicts function membership in a form not directly supported in UML.
The current version of UML supports neither dataflow nor function diagrams in the forms defined above. UML does support state-transition diagrams that have similar semantics to dataflow diagrams. In a state-transition, nodes are shown as rounded rectangles. This may cause some confusion with our use of rounded rectangles for functions. However, the edge shape in a UML state transition diagram is different than in a function diagram, so that the two forms of diagram can be distinguished.
It should be noted that all of the above notations except for function diagrams
are orientation independent. That is, diagrams can be drawn vertically,
horizontally, or any combination of orientations. The restriction for function
diagrams is that a calling function must be drawn above or to the left of the
functions that it calls.
1 The location of the UML web page changes frequently. If the link given here is not found, go to the main site at www.omg.org and search for "UML Spec" with their search engine.