2.7.1 Histogram
The histogram is useful for not only viewing the spread of grades in the class, but also for modifying that spread to match your desired grade breakdown. While the default is the standard A-F +/- grade style set to the normal values such as A = 92%, A- 90%, etc. You can easily change the grading scheme by clicking on the "Grading Scheme Manager" button, which opens the window seen in 2.4.1.3 allowing you to add, rename and edit the values for each mark. The standard grading format used in the default histogram is shown in figure 1.

Figure 1: Histogram with default grade scheme
Another easy option to modify the values for each mark is to simply drag them up and down to their desired location. The histogram automatically updates the percent sizes for each mark. Figure 2 shows what happens when the 'A' mark is dragged up to equal 94%.
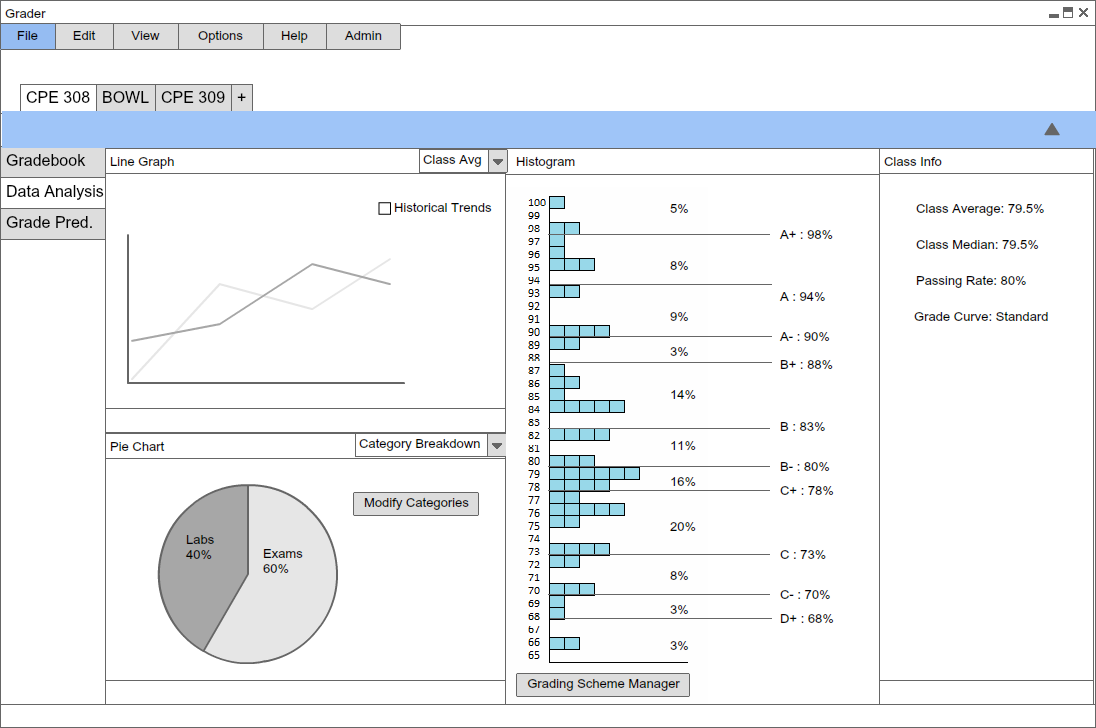
Figure 2: Histogram with 'A' mark changed
To avoid accessing the Scheme manager window to simply delete a mark, all you need to do is just drag a mark off the histogram box, and the histogram will automatically merge the students in the mark into the next lower mark. Figure 3 shows what the histogram would look like if you were to drag the 'A+' mark off the histogram box.
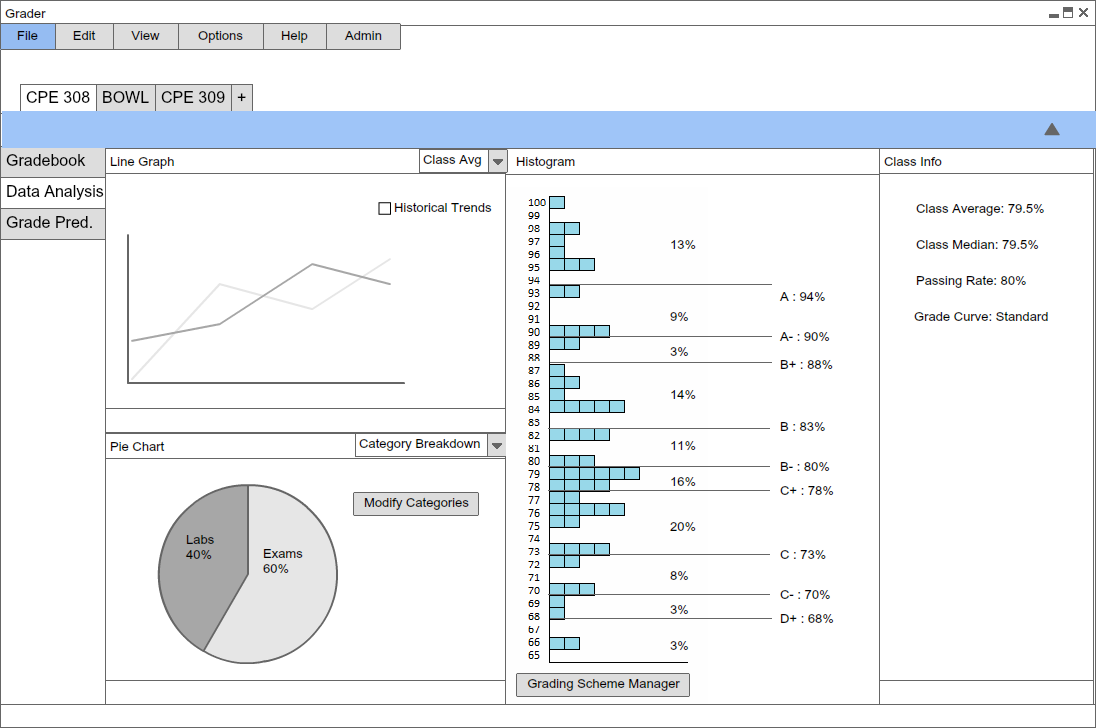
Figure 3: Histogram with 'A+' mark removed
Dragging a mark into another mark causes them to have the same value, and appear together on the line, as seen in Figure 4. Once joined, they move together as one grade, as seen in figure 5. The individual mark can be dragged down to break them apart if so desired.

Figure 3: Histogram with 'A' and 'A+' combined

Figure 3: Histogram with 'A' and 'A+' mark combination moving together
Every modification and deletion made in the histogram instantly affects the grades in the actual gradebook, (seen in 2.1 Figure 3), making the graphical tool not only useful for viewing the gread spread of a class, but also an easy and dynamic way to modify the grading scheme.