
| Requirements | Specification | Prototype | Design | Implementation | Testing | Administration | Documentation |
|
|||||||||
|
Easy Grader is able to plot the score of every student in the class section into graphs. To plot graphs, go to View menu on the menu bar and select Graph (See Figure 4 in section 2.1). The graph window then pops up and display the plotted graph as shown in Figure 25. There are two tabs in the graph window for 2 different types of graph, the Histogram and Pie Chart. On the right side of the window, there is a box and text fields for the users to enter percentage in order to adjust the curve of the section. See subsections for details of each graph.
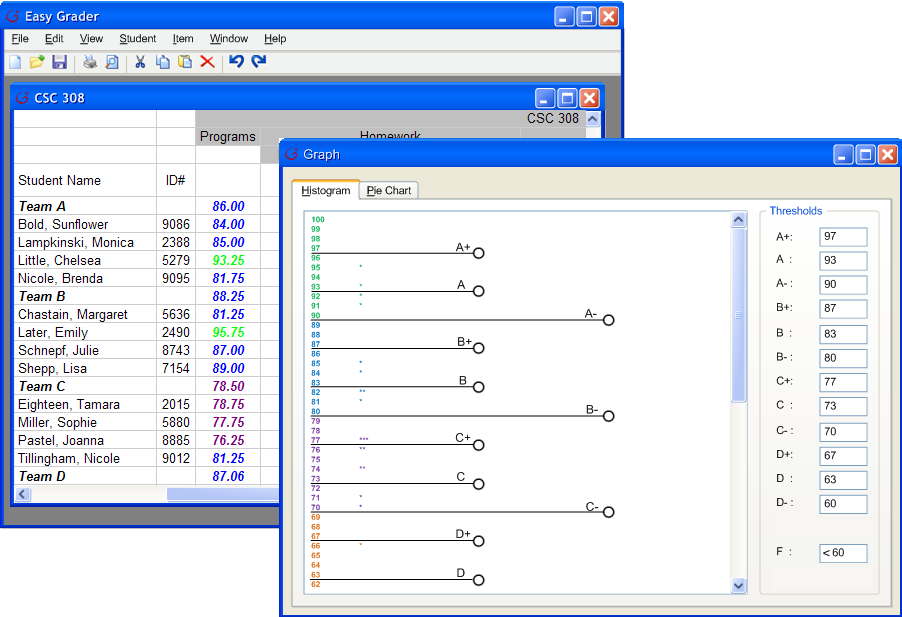 |
| Figure 25 |
Users are able to plot the score of the students in the class section as histograms. To do so, go to View menu on the menu bar and select Graph. After the Graphs window pops open, click on the Histogram tab.
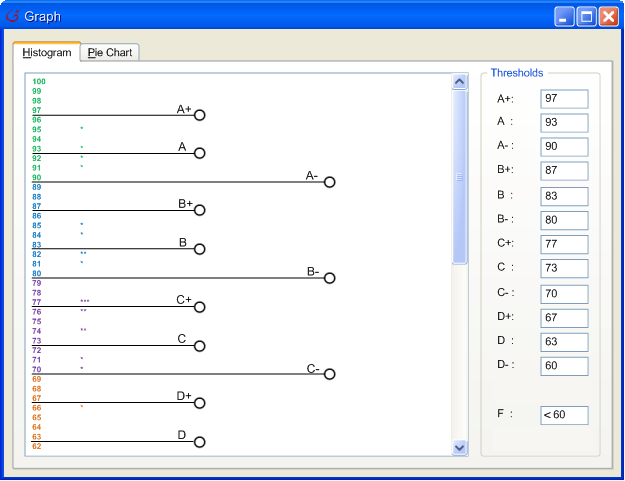 |
| Figure 26 |
The users can adjust the curve of the class by grabbing the slide bars on the graph and sliding it along the graph. The percentage of each letter grade will be automatically displayed in the text box on the right-hand side. When the slide bars run into each other, continuing to slide the bar will cause the next bar to slide with it. The bars will eventually merge into one. The bars with eventually merge into one. To undo this, the user can double-click on the merged bar to un-merge them again.
The users can also adjust the curve by directly entering the desired percentage inside the text box and the slide bar on the histogram will be automatically set to that position.
Adjusting the curve this way will also change the letter grades on the gradesheet.
 |
| Figure 27 |
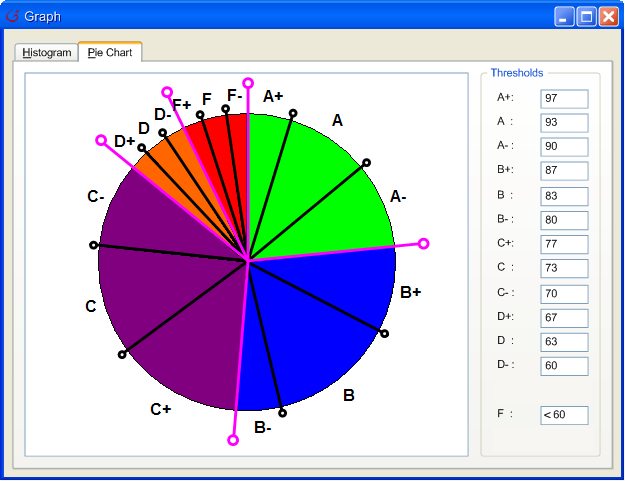
Users are able to plot the score of the students in the class section as pie charts. To do so, go to View menu on the menu bar and select Graph. After the Graphs window pops open, click on the Pie Chart tab.
The users can adjust the curve of the class by grabbing the handles on the graph and dragging it along the graph. The percentage of each letter grade will be automatically displayed in the text box on the right-hand side. When the handles run into each other, continuing to slide the handle will cause the next handle to slide with it. The handles will eventually merge into one. The handles with eventually merge into one. To undo this, the user can double-click on the merged handle to un-merge them again.
The users can also adjust the curve by directly entering the desired percentage inside the text box and the handle will be automatically set to that position.
Adjusting the curve this way will also change the letter grades on the gradesheet.