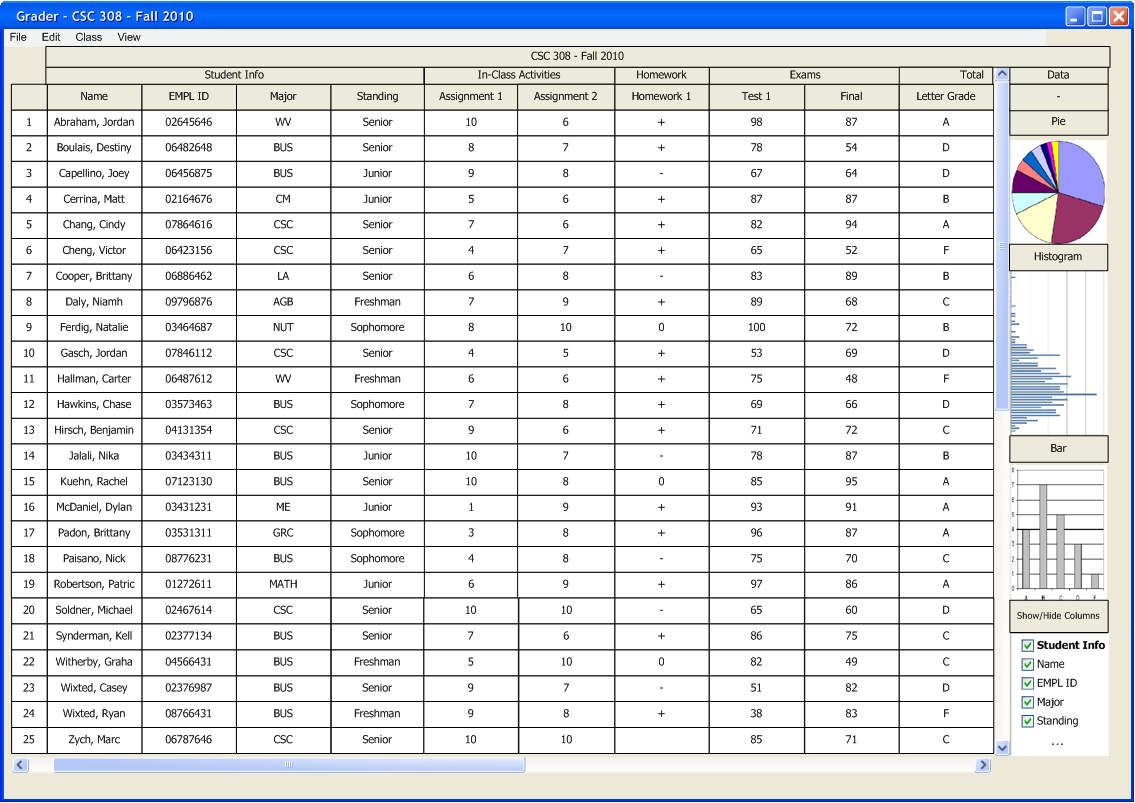
Figure 2.6.1a: Spreadsheet with sidebar active

Figure 2.6.3b: Bar Graph Initial View
When the user hovers the mouse over a bar additional information is shown.
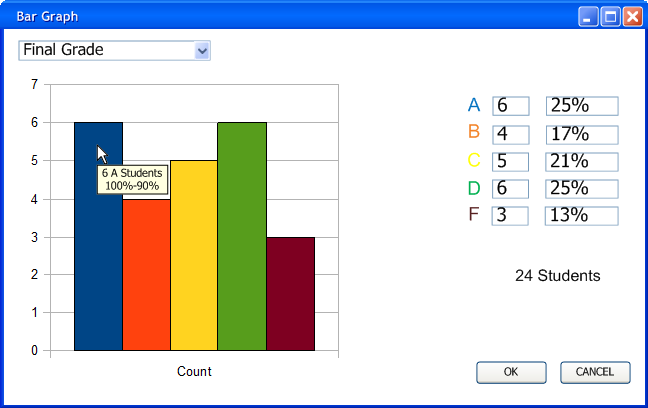
Figure 2.6.3c: User hovering over bars shows additional information.
Other assignments and categories are also viewable. The user selects the category or assignment from the drop down menu. Sub-categories are shown using arrows items without arrows are graded items.
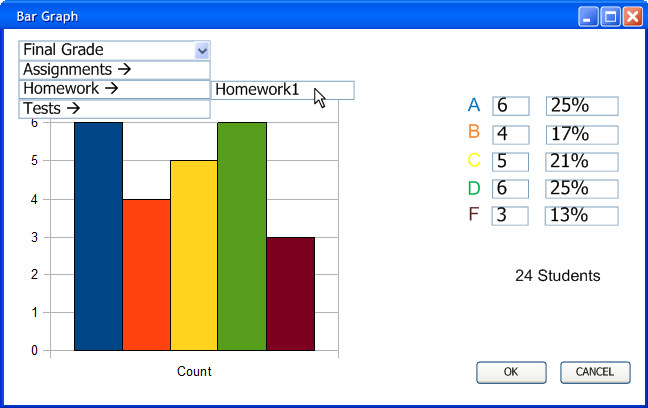
Figure 2.6.3d: Choosing display categories.
The grade scheme is also applied to these assignments, as shown in figure 2.6.2e.
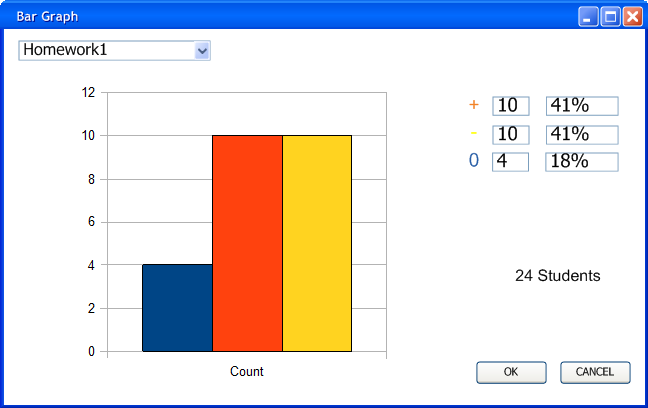
Figure 2.6.3e: Showing homework 1 grade scheme using the bar graph.