A project demonstrating the ability for CUDA to improve the rendering time of generated textures as well as the benefit of mapping those textures onto a 3D, interactive model for data analysis by Brian Volk and Peter Faiman.
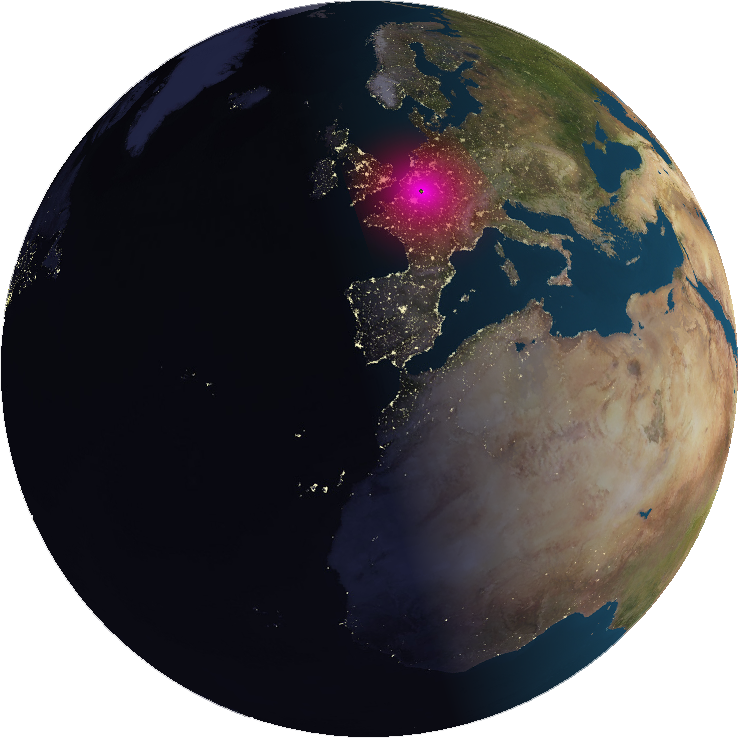
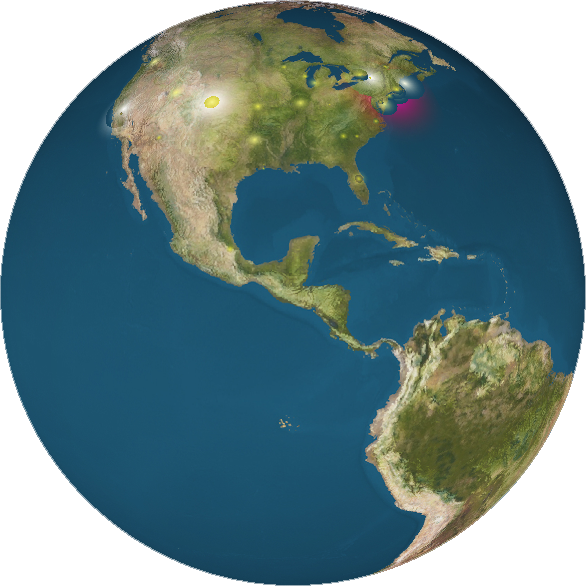
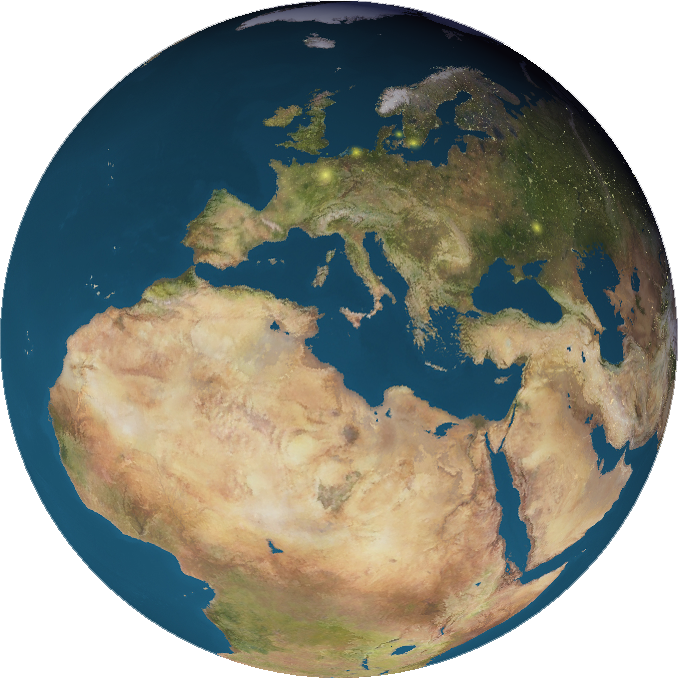
The program parses a pcap (packet capture file) provided, then generates a heat map based on the GeoIP results of the captured packets source addresses. This heat map is drawn so that each gradient dot is correctly adjusted for texturing onto a sphere and appears on the sphere as a circle. This was done by using the Haversine distance formula to determine the arc length between two angles on a sphere. The above image is part of the heat map texture saved to a file after generation. The left is the North America and the right dots are in Europe. Hovering over the image will reveal the relevant Earth map section.
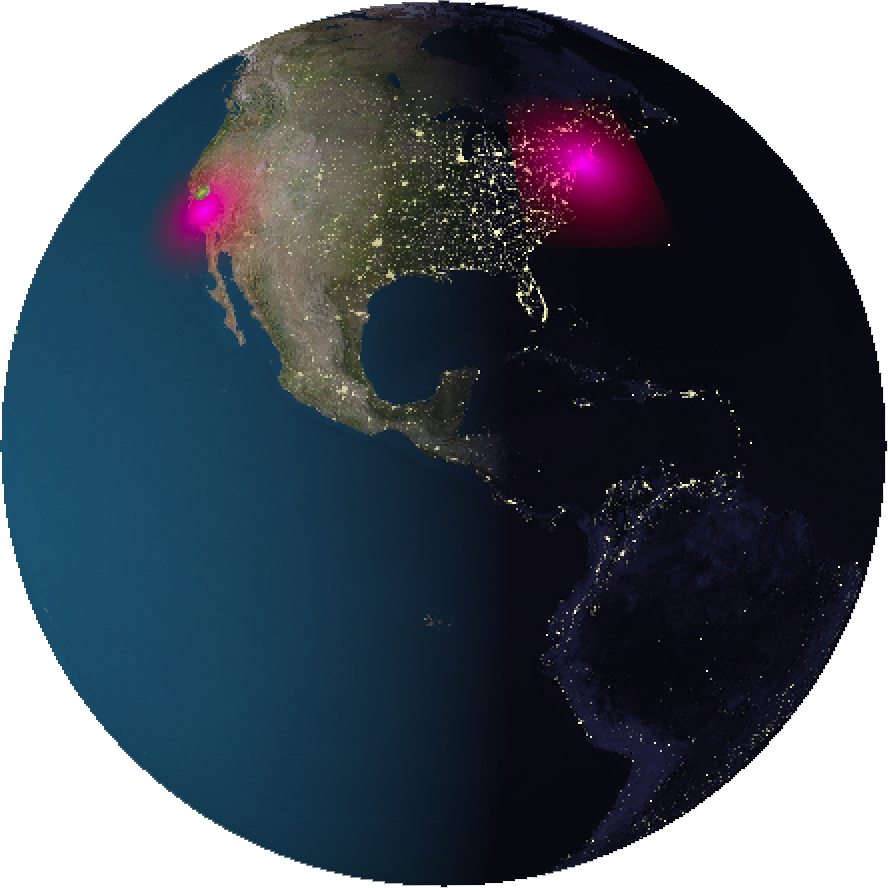
Notice the distortion towards the top of the image. Because the radial gradients are calulated using the arc length of the distance between degrees of latitude and longitude, they are distorted on a 2D image. The image in the right corner is this mapped onto a sphere. Hovering over will enlarge the image. You can see on the image how the distorted gradients on the 2D texture look circular on the sphere.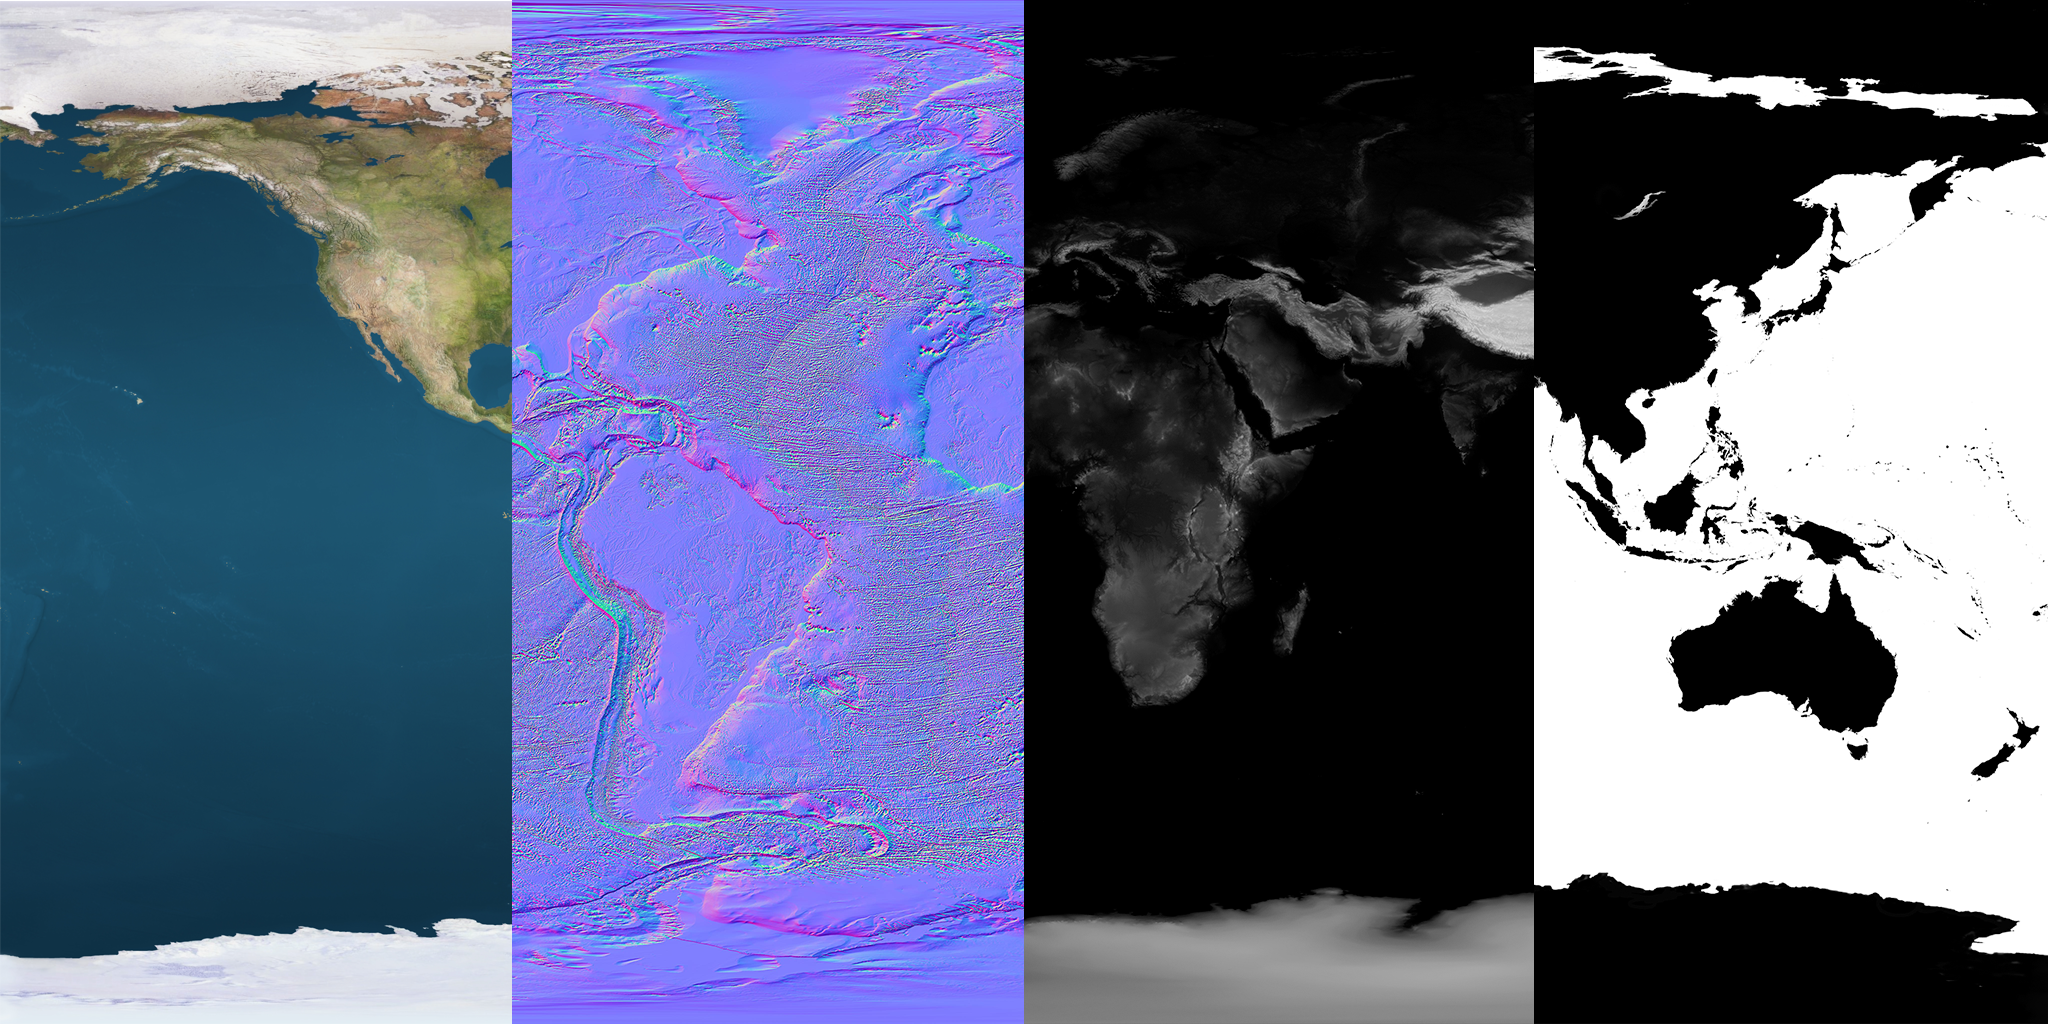
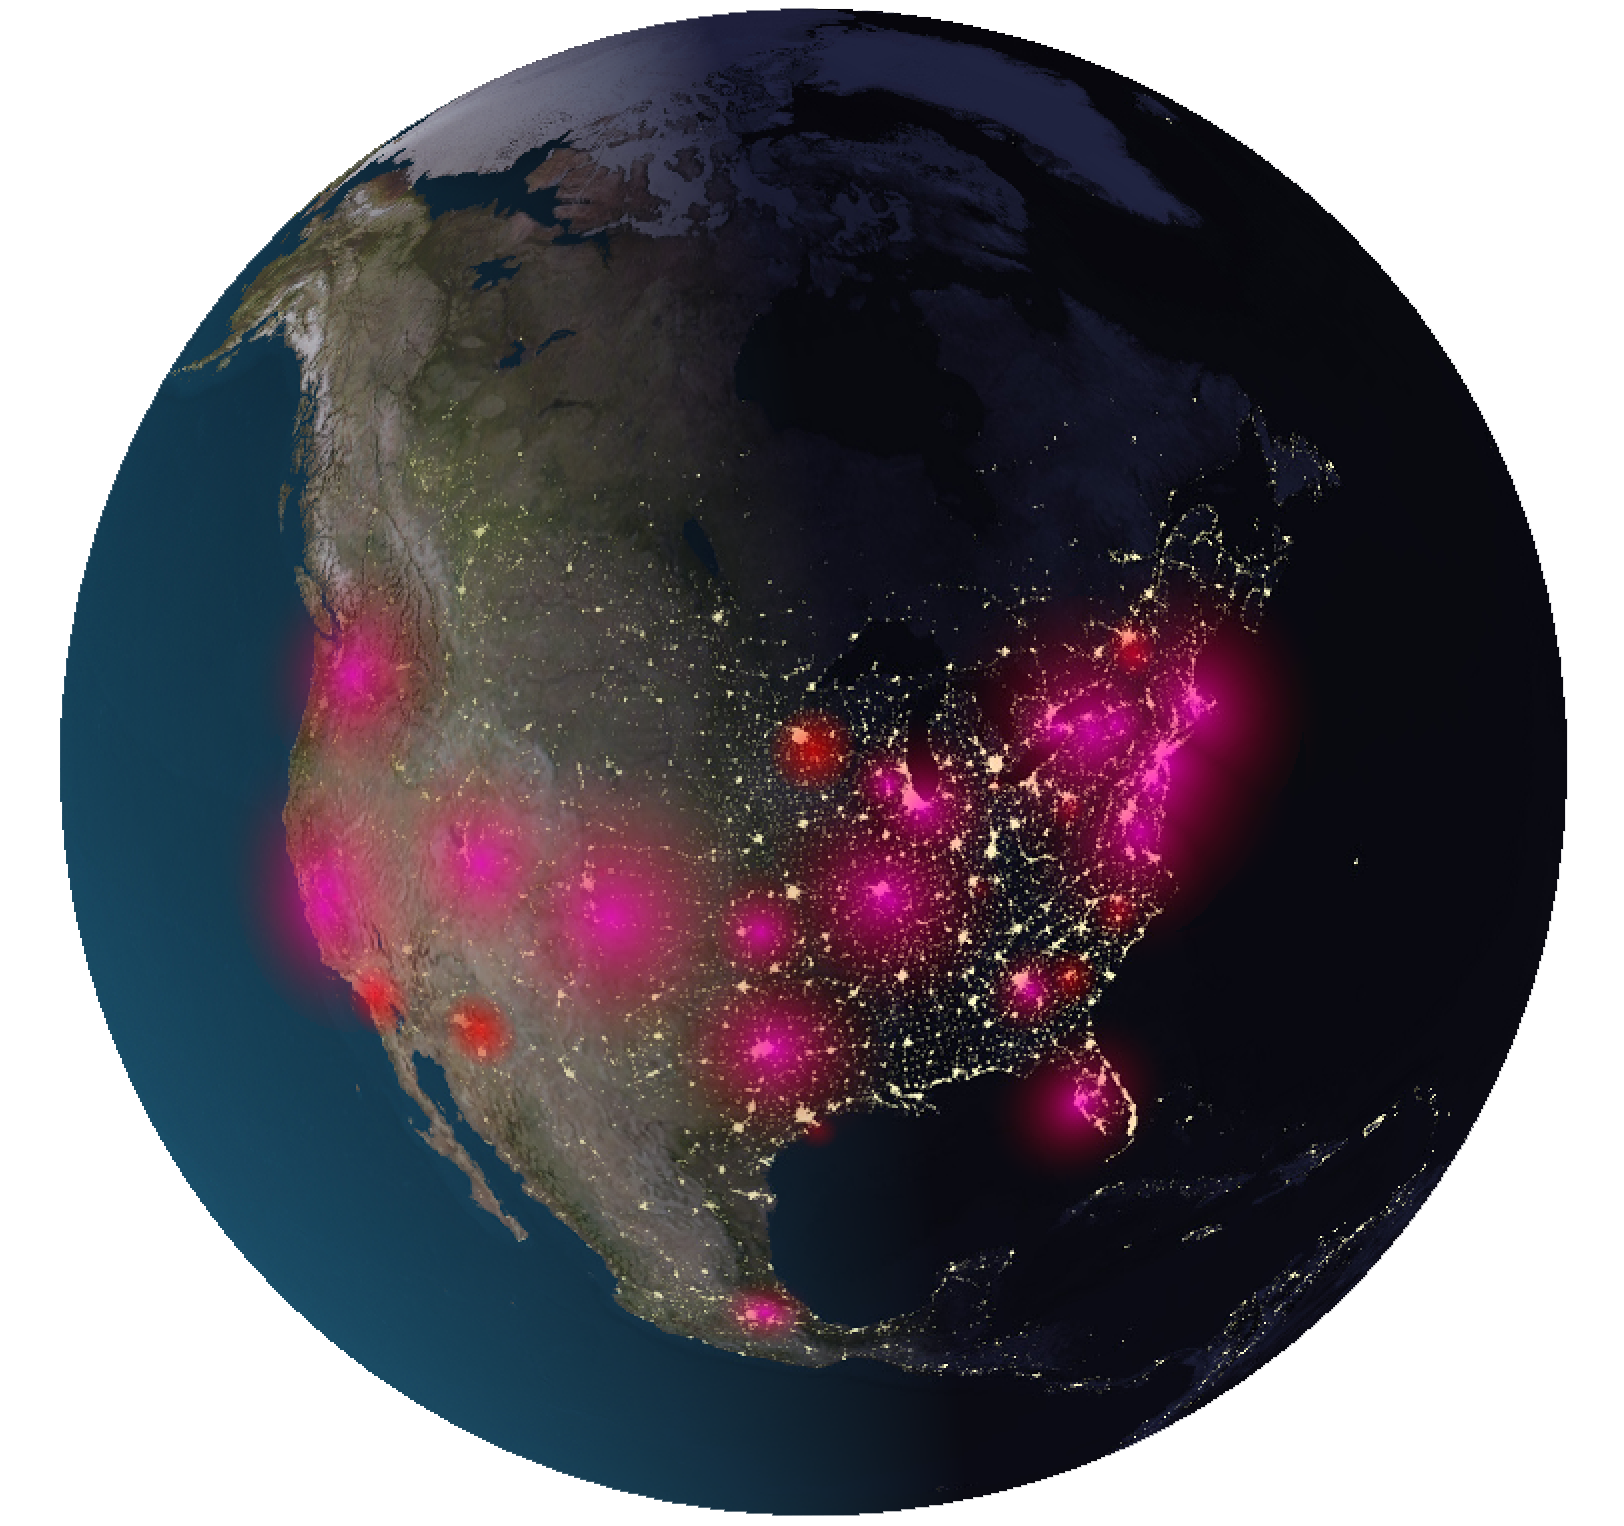
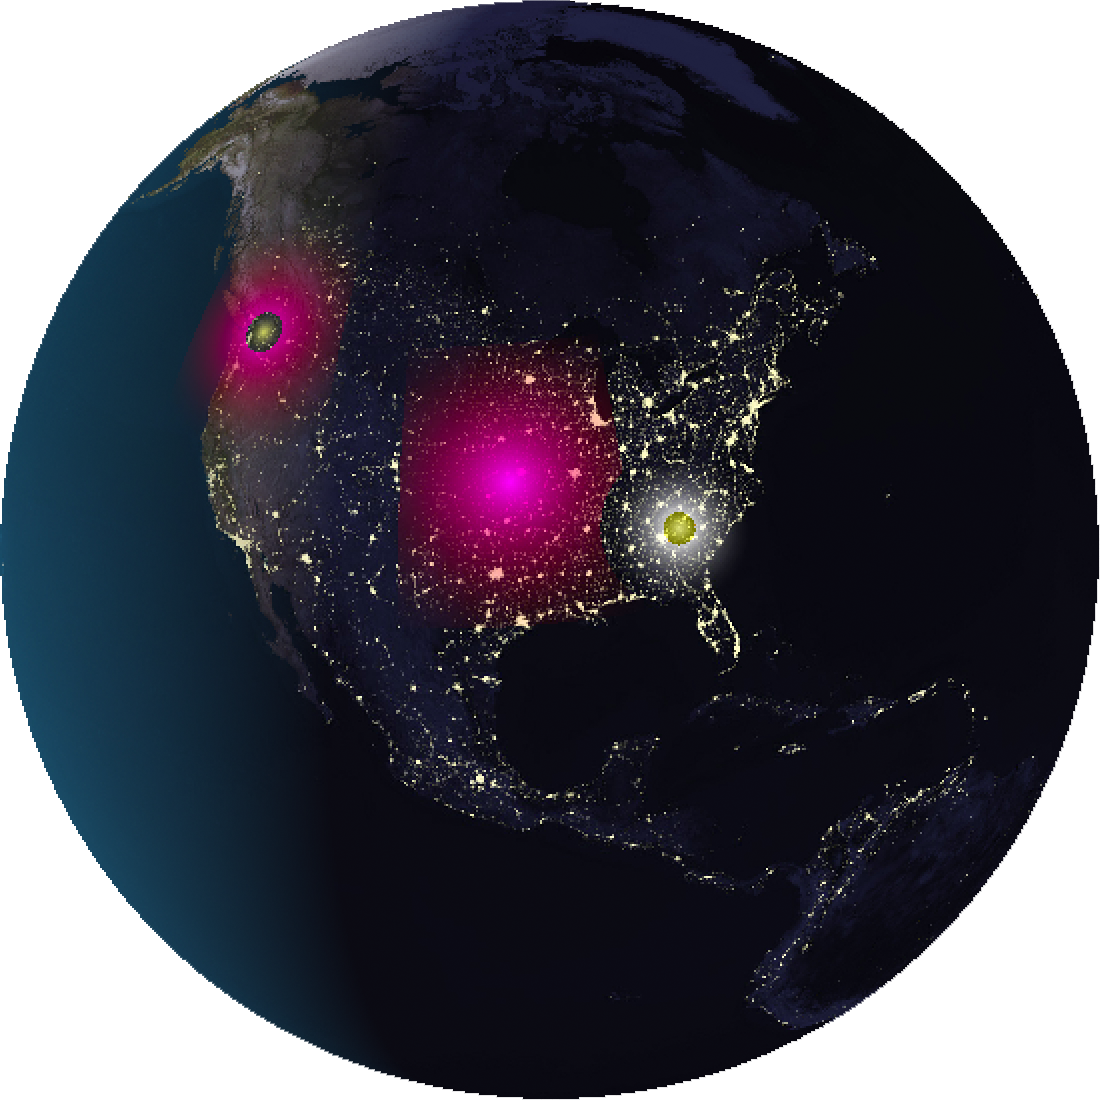
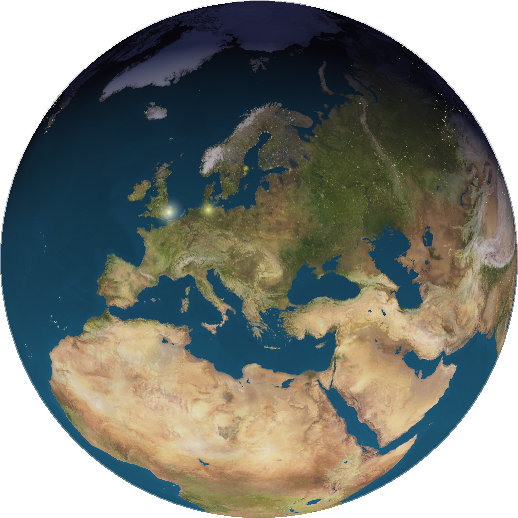
Using OpenGL shaders we mapped the textures of the Earth and the Earth at night onto a sphere. Then using lighting calculations, we made it so that instead of shading, the night texture was used. After these were mapped, we mapped the heatmap texture onto a imperceptibly larger sphere. The heatmap texture was transparent so the earth can still be seen underneath.
Future work will include using the above normal, height, and shine maps to create a much more realistic model with little increase to the model complexity. Additionally, having for a direct connection to a network interface would allow for rolling averages which could be switched between to see traffic from the last 15 minutes, few hours, or since the program initialization. We also hope to be able to filter by protocol and improve the GPU color and heat map smoothing.