For my graphics final project, I decided to make an audio visualizer. I made my decision after looking through past projects and remembering another past final project where I made a simple hardware audio spectrum analyzer.
A demo of my visualizer with the song Iron by Woodkid (Mystery Jets Remix). The audio and video are only a little bit off. It runs smoother on my computer and the beat detection is more synched, but out of all the other screen recorders I've tried, this was the best. (Sorry for the bad audio)
Audio AnalysisFMOD
This project takes in an audio file (so far only tested with MP3s) and uses the FMOD audio library to do real time analysis of the frequencies of the audio. It does this using FFT techniques to interpret the digital data as frequencies. Ranges of these frequencies are then divided into separate channels based on your decided sample size and can be stored into a float array based on the intensity of that frequency range. These channels were the data that I used to put on screen. In order to get more precise data to visualize, I took the frequency spectrum from both left and the right channels and made a third spectrum array with the average intensity of both channels. It is these values that I then use for my visualization.
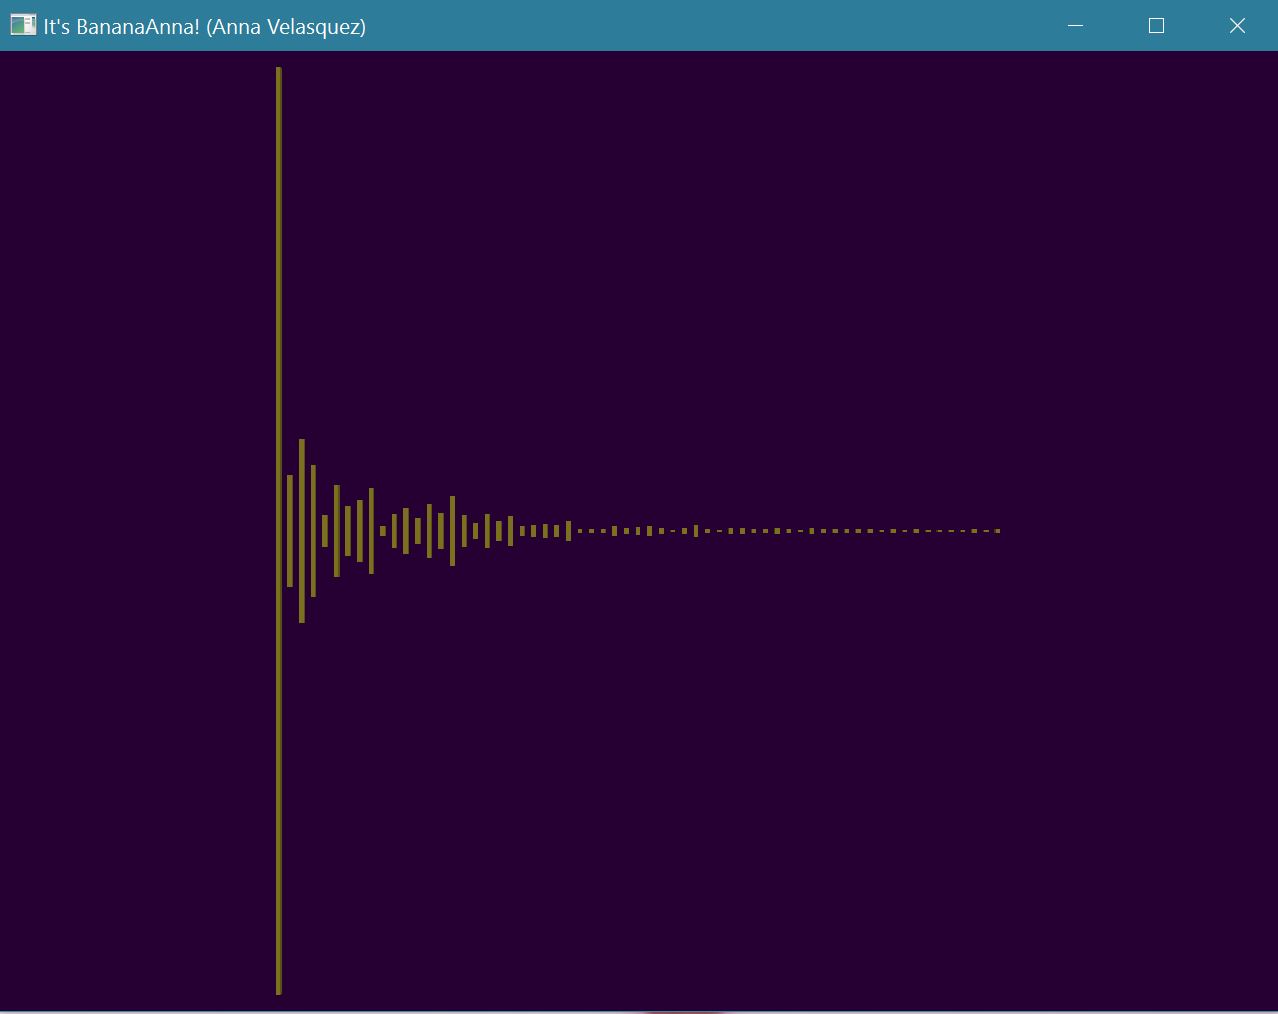
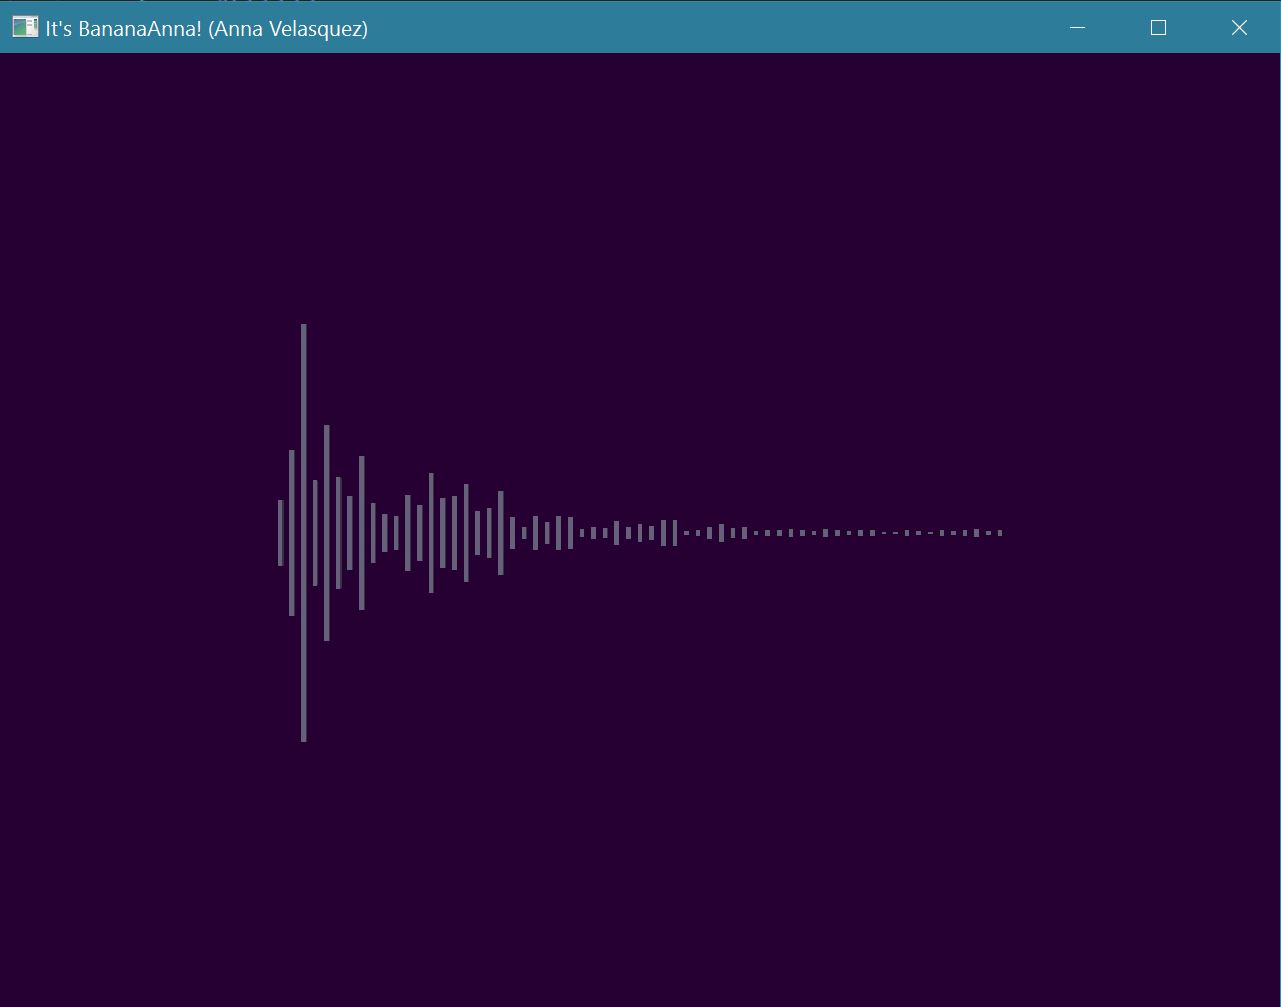
VisualizationAudio Bars (Iteration 1)
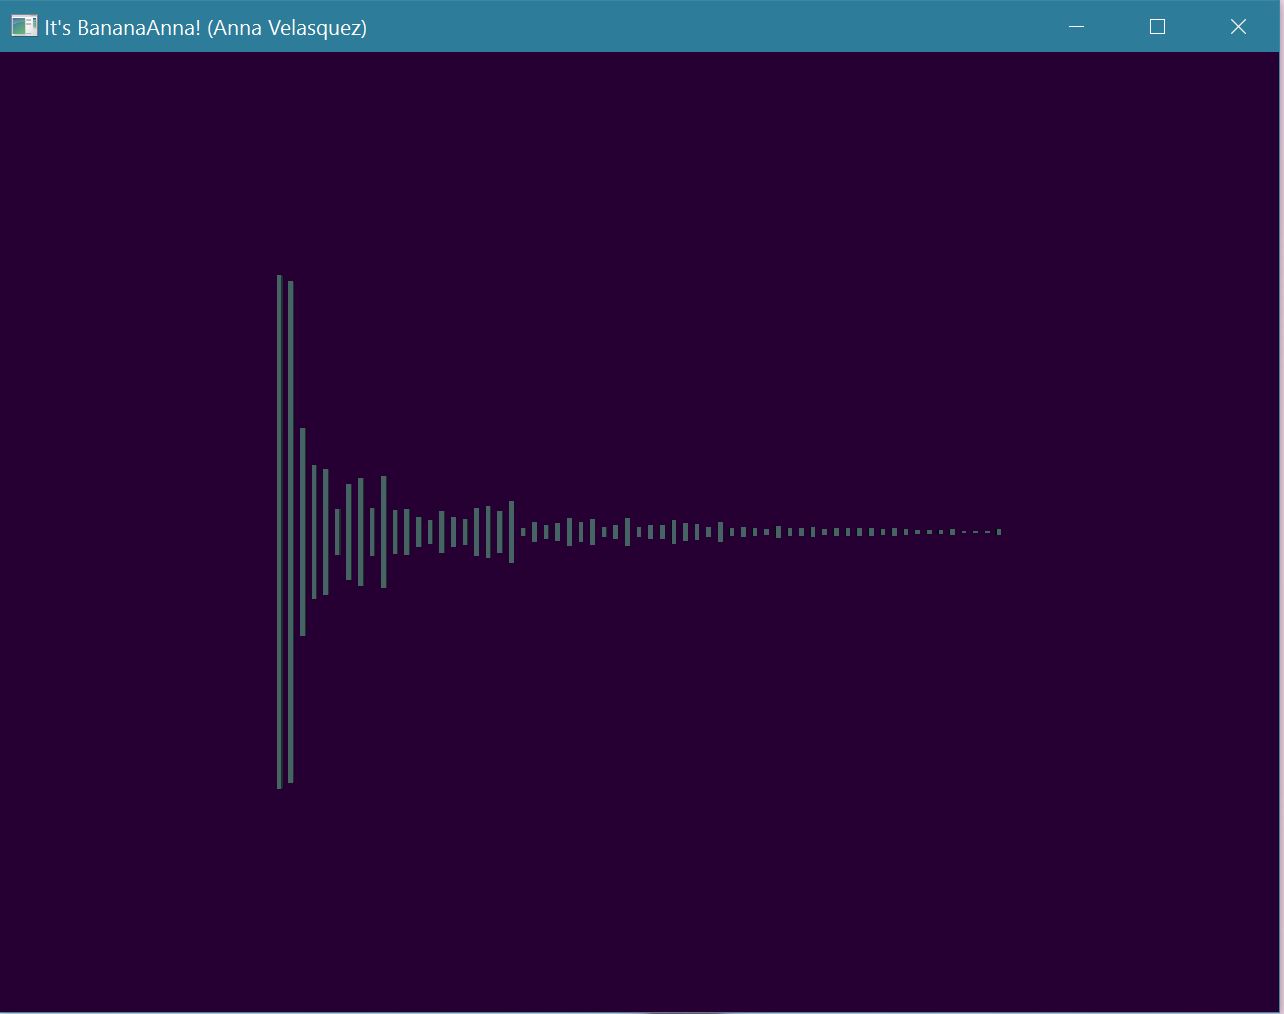
The first visual I made was a simple set of audio bars. I have row of 64 bars representing 64 sets of frequency ranges from the averaged spectrum array. The height of these bars are simply based of the intensity of each channel. The bars go from low frequency to high from left to right.
Although this isn't very exciting visually, this mode helped a lot when I started to do beat detection (shown by the flashing colors in this mode). It's also easier to see the audio analysis in a more intuitive way.
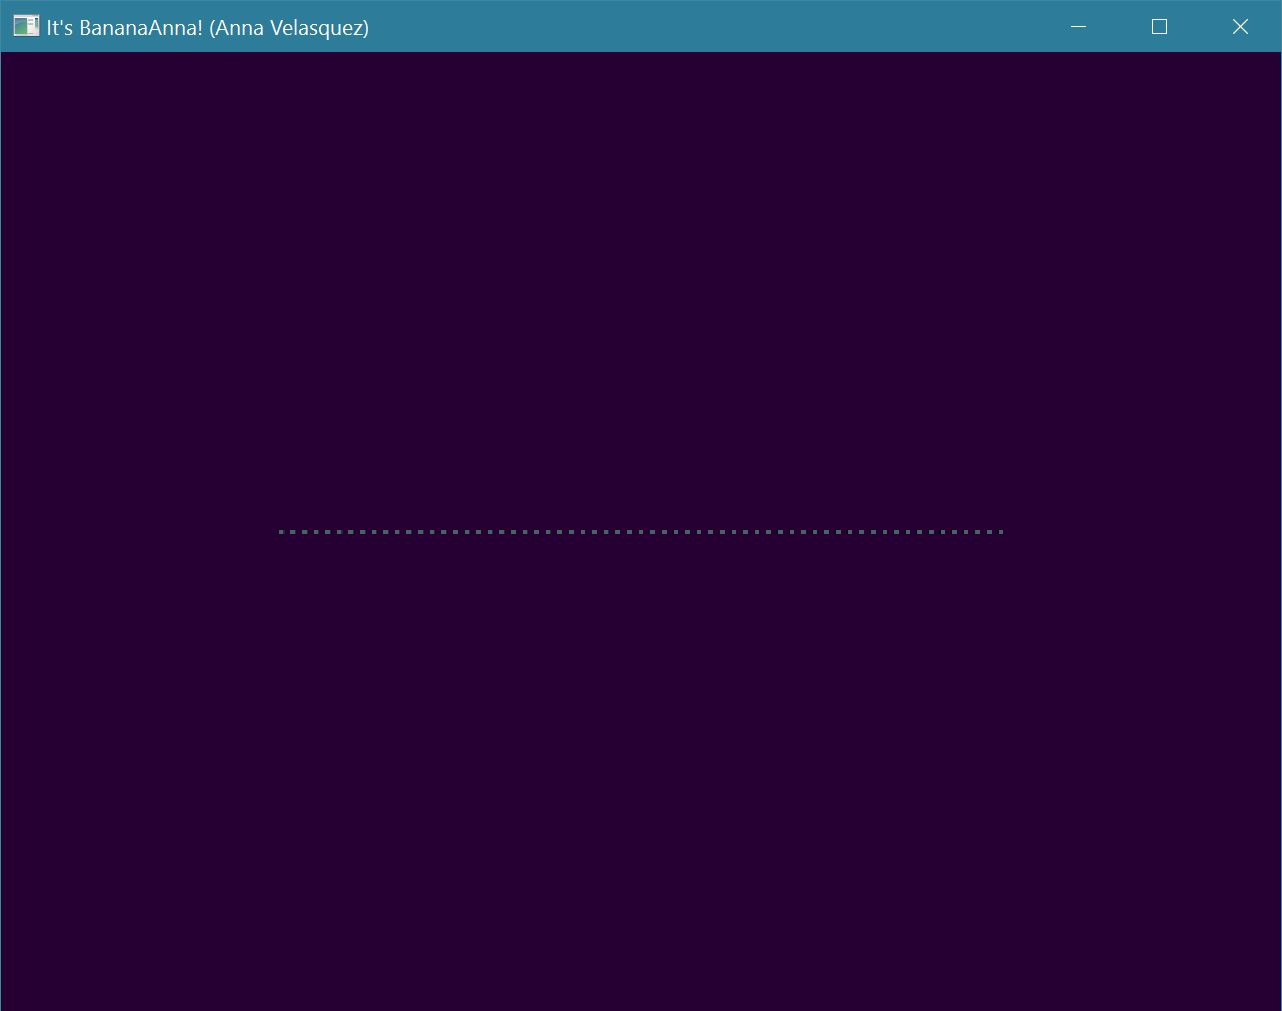
Audio Bar mode in pause
Audio Bar Sample 1
Audio Bar Sample 2
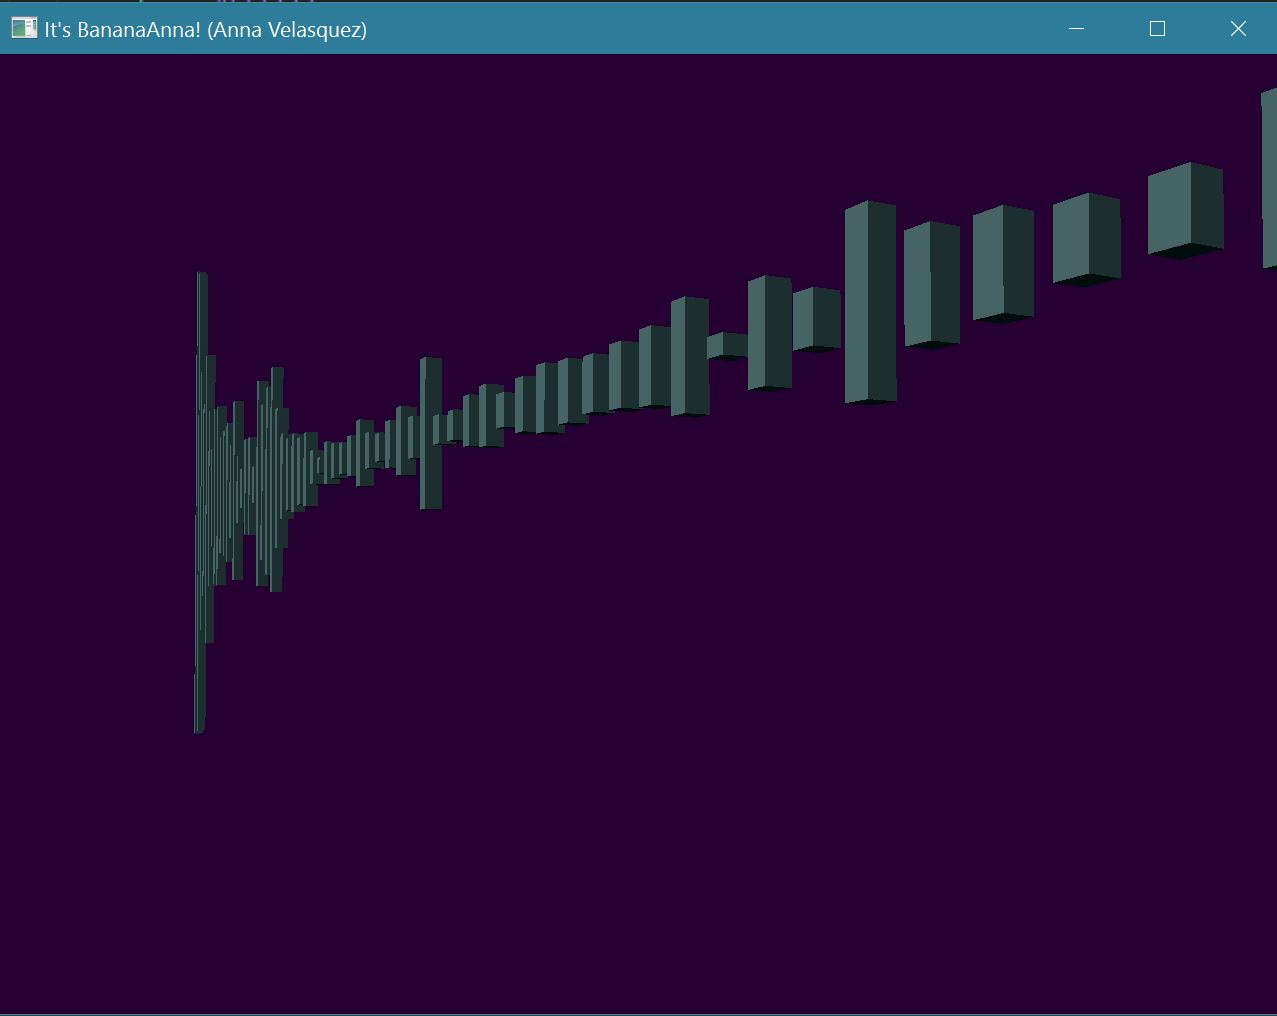
Audio Bar different view
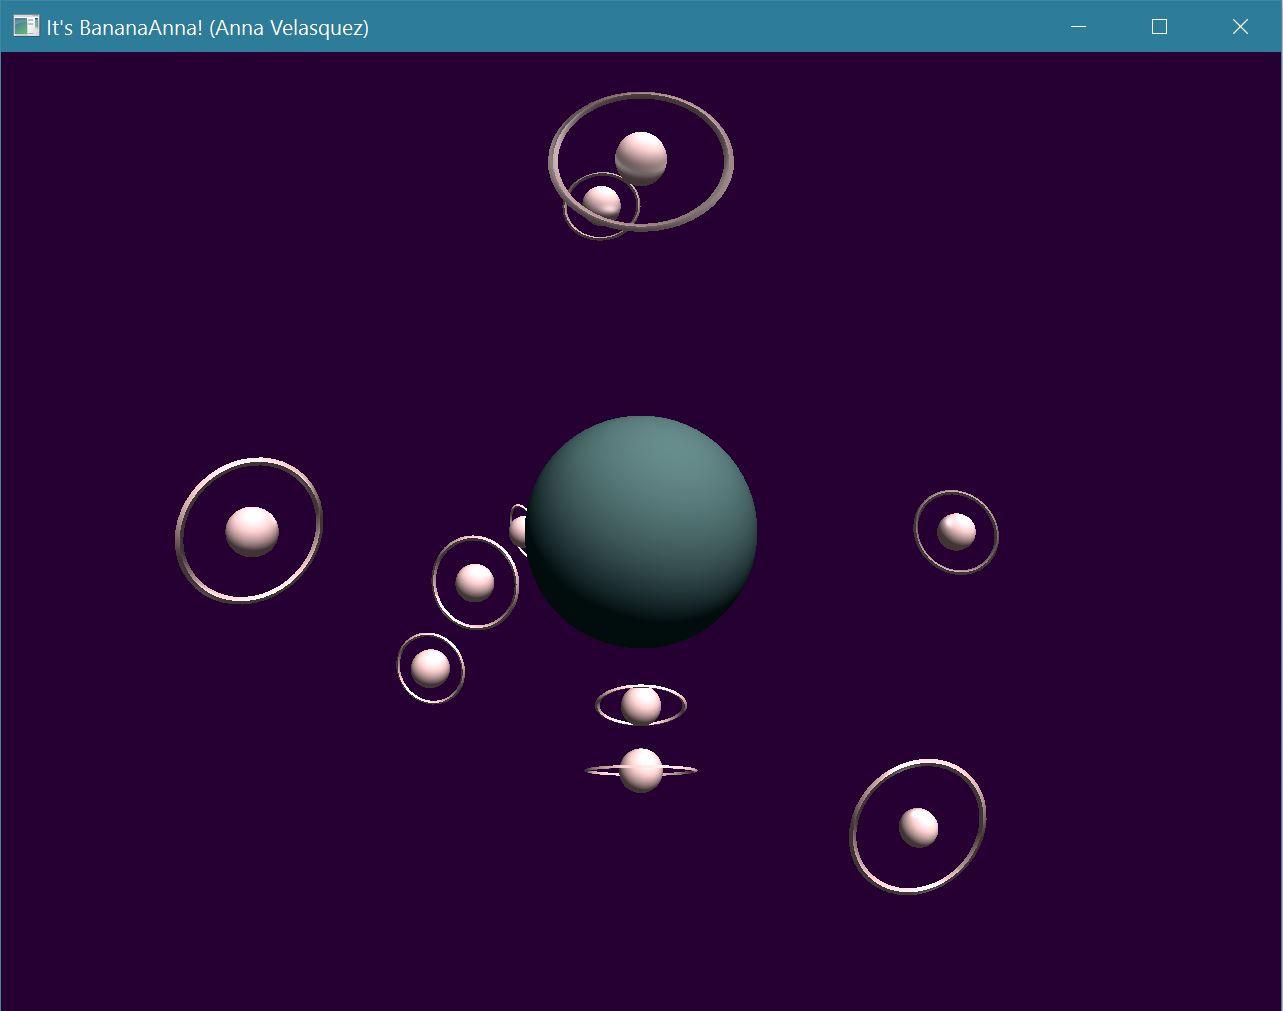
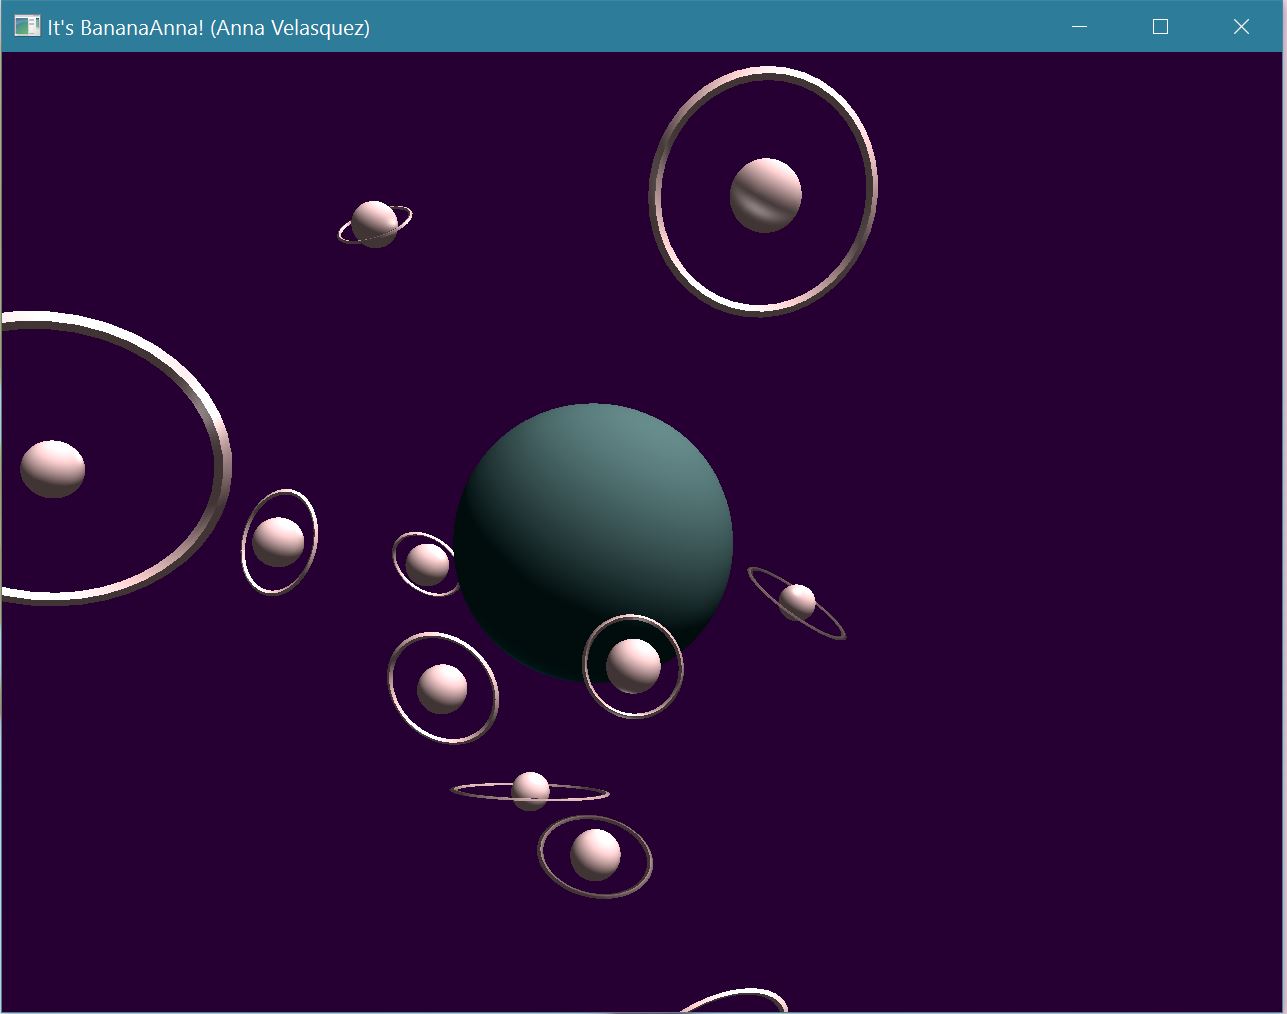
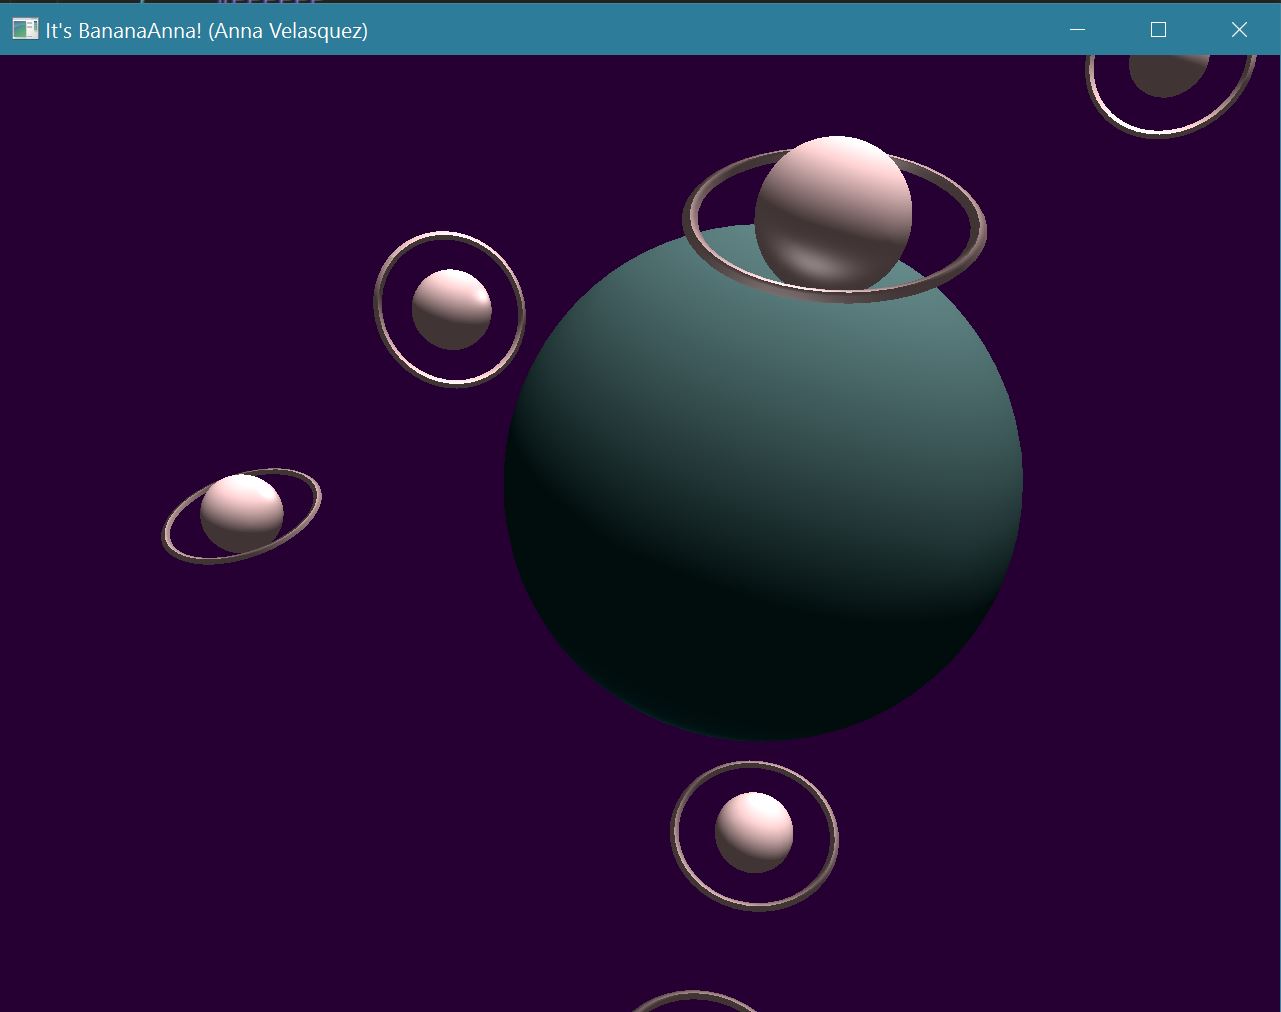
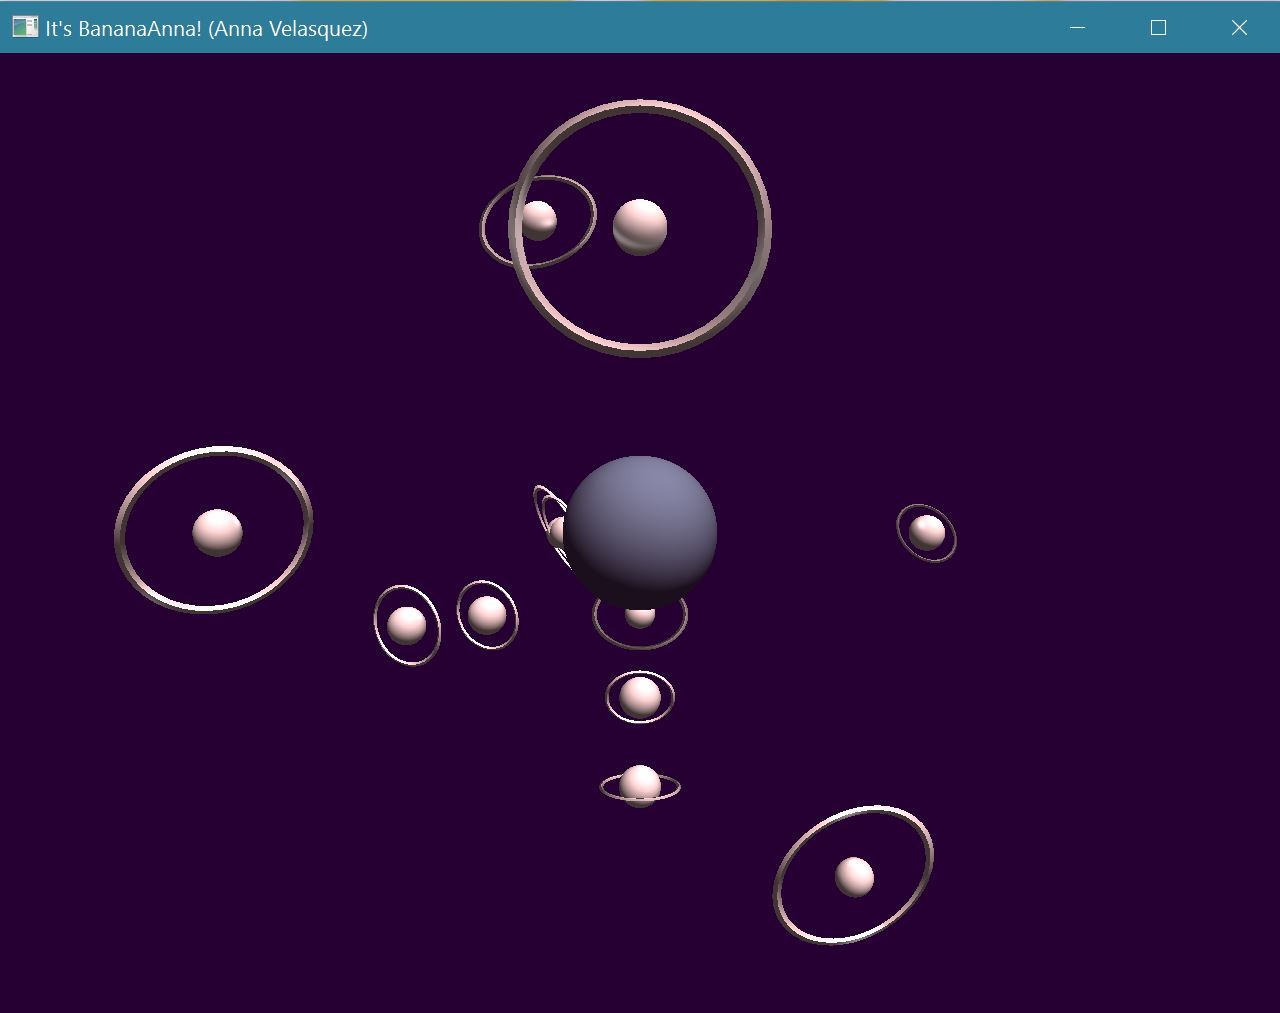
Planets and Rings (Iteration 2)
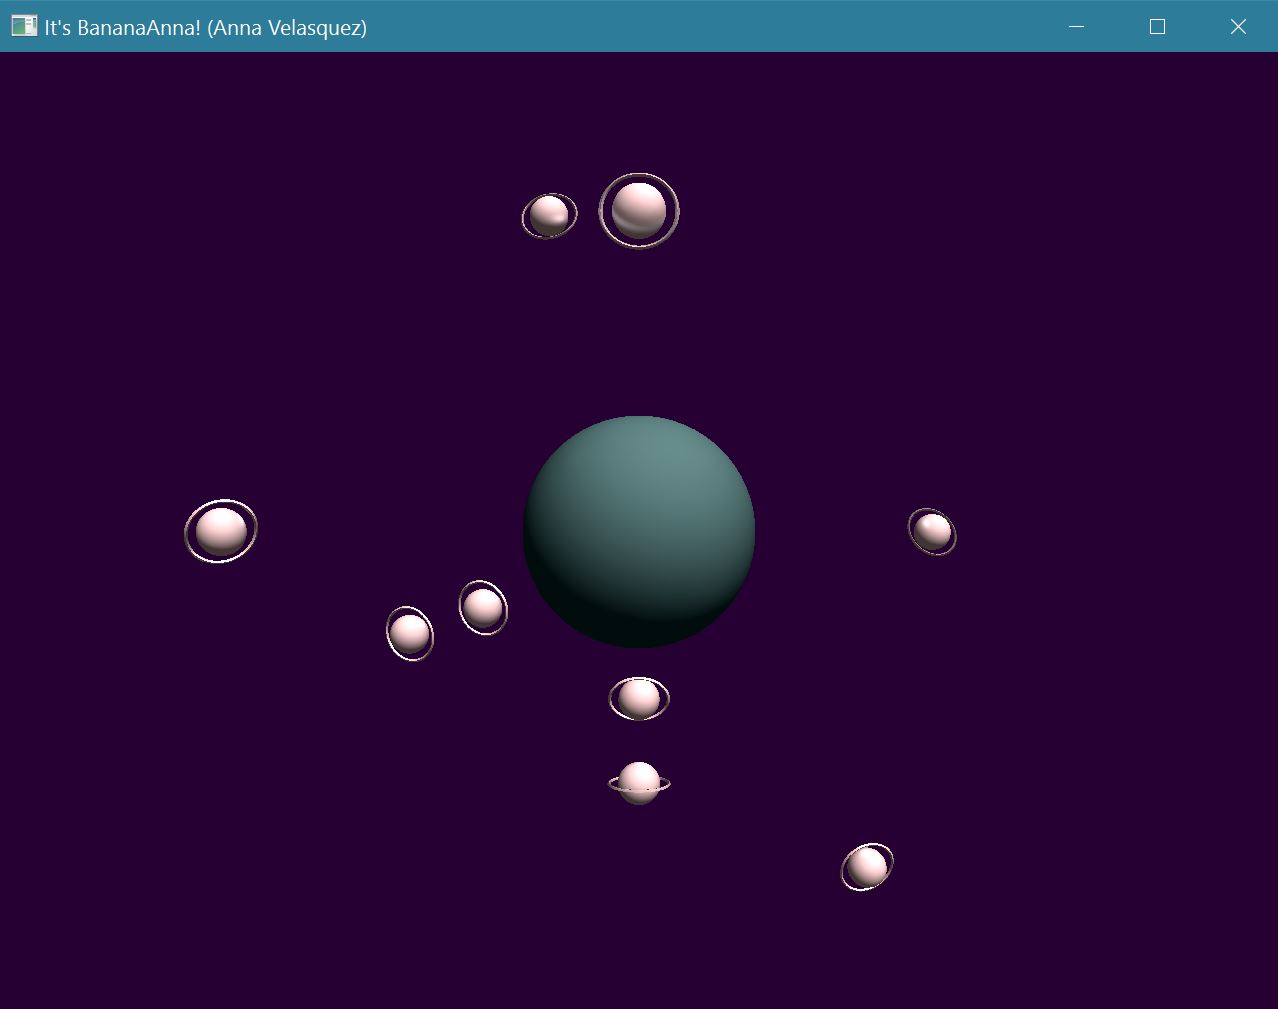
To make my visualizer more interesting, I decided to do a simple hierarchial animation of planets orbiting around a large sphere. The middle sphere represents the beat detection of the song while the circling planets and their oscillating rings represent the different frequency channels.
The hierarchy of this model goes from the rings are centered and revolving around the planets which are then orbiting around the center of the big sphere.
Planet mode in pause
Planet Sample 1
Planet Sample 2
Planet different view
Beat Detection
To add some more visual interest to my visualizer, I wanted there to be an effect when there is a heavy beat in my song. The beats I wanted to visualize were a loud low bass thump and a crash snare sound.
The first one I tried for was the bass. After visually analyzing the audio bars for a while, this was simply detected once the lowest frequency exceeded a threshold. A similar method was used to find out how to detect the snare. I had to choose which frequency bar correlated the most when I heard a snare crash and figure out what the threshold was. This involved a lot of guessing and checking. Even now, although I think the bass detection is fine, the snare detection is still a bit iffy.
For the audio bars, they simply change gold when a bass beat is detected and silver when a snare is detected.
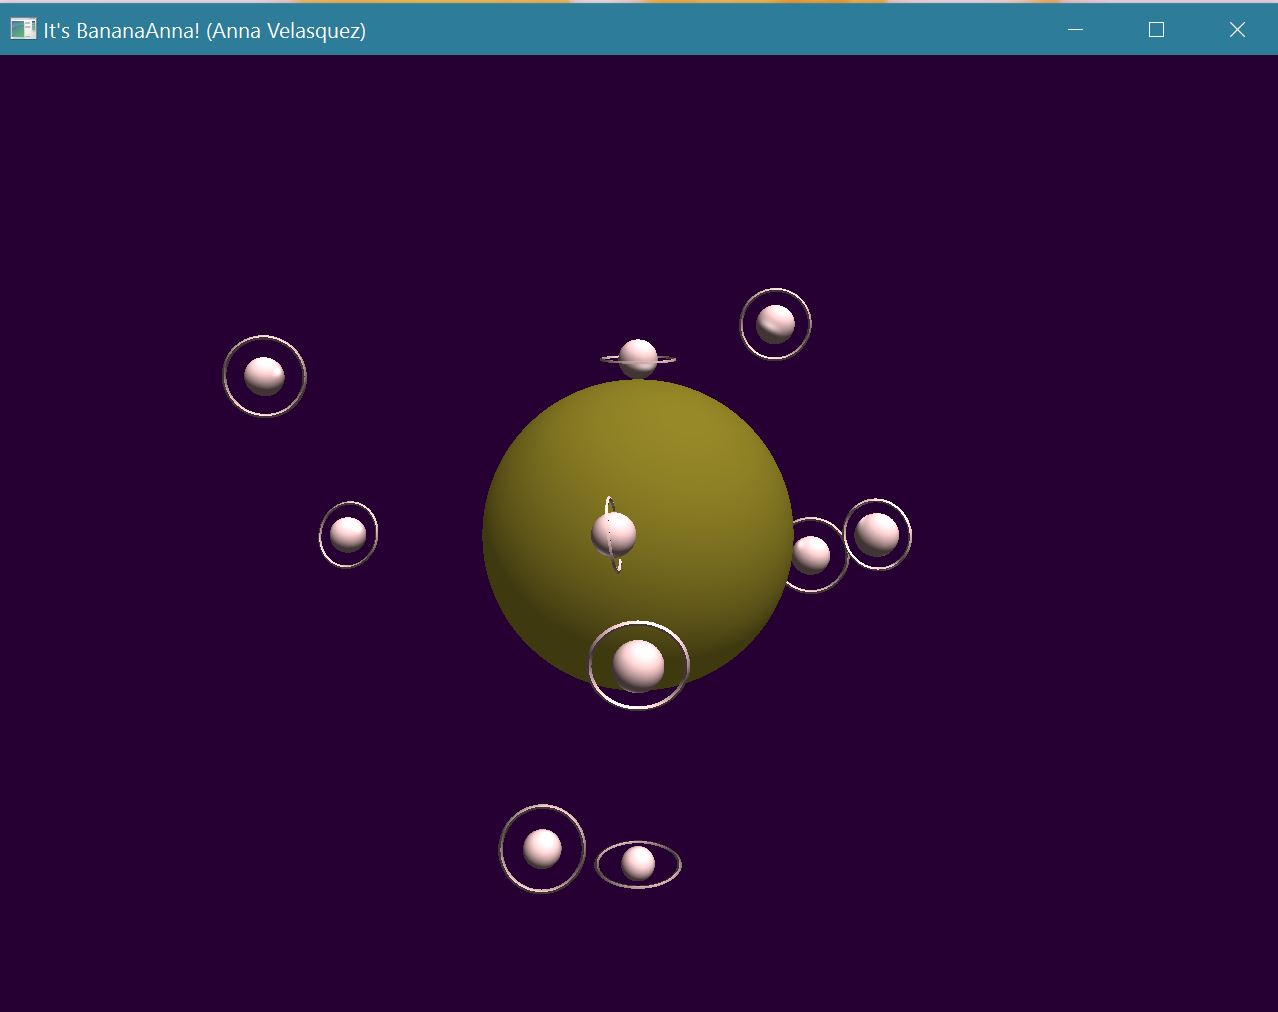
For the planets, the center sphere also keeps the same color scheme as the audio bars, but in addition, it grows with the bass and shrinks with the snare.
Another thing about the beat detection of my visualizer is that this works best for similar genres to the song I ended up using. I tried a variety of songs, but if they were too different, I had to change the conditionals and thresholds of my beat detection.
Also, for visual aesthetic, I have a counter to keep up the beat detection effect for a short period of time after a beat was detected. This was because if I didn't, sometimes the beat effect wouldn't look as solid (such as the rings of the planets), because of persistance of vision, if the channel bounced too quickly from high to low intensity per render frame.
Planet mode bass detection
Planet mode snare detection
Audio bar mode bass detection
Audio bar mode snare detection
Visualizer ControlsControls
Listed below are some of the controls that a user can use with my visualizer such as camera controls, pause/play, and a visualizer mode toggle.
W - Camera zoom in.
S - Camera zoom out.
A - Camera strafes left
D - Camera strafes right
Mouse - Pitch and Yaw controsl
Space - Brings camera back to 'home'
P - Play/Pause music (Music starts paused)
M - Toggle between visualizer modes (Mode starts as audio bars)
Conclusion and ResourcesConclusion
In conclusion, I learned a lot from this project about the difficulties that happen when trying to use a new library in a short amount of time. The most fun thing I learned was how to synch music to visuals on screen in a way that I enjoyed looking at. Lastly, I also brushed up on some hierarchial models and some simple animation.
Resources
Below are some resources that helped me figure out how to use the FMOD library for audio analysis