The video above is a screen recording of the visualizer running on my computer. It plays through a couple minute of
the song in order to give an idea of how the visualizer runs.
The first big challenge that I had to face was figuring out how to use Essentia to get information about the audio.
After playing around with it for a bit I decided on using 2 pieces of information, the volume and the audio spectrum.
The Spectrum data was used for the line, while the volume data was used for the spheres. The size of the spheres is
directly tied to the volume of the audio, while the color of the spheres is based on the volume going above a set limit.
The line is formed by using a line string between the points created using the spectrum data. It is then colored based on
the y value of the spectrum wave. It is split into 3 sections so the lowest section has the aqua color, while the middle
section is green and the highest section is red.
The coloring of the spheres is done mostly in the fragment shader. It uses a combination of the normal and the position
of a light source. The light source is moved in the render function if the volume hits a certain threshold. The coloring
of the line is done by setting a vertex color based on the y value in the vertex shader so that it would be interpolated
when it got to the fragment shader causing a nice blending between the colors.
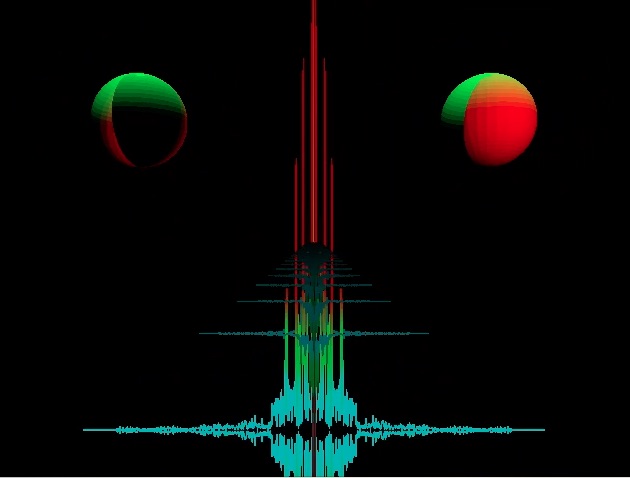
The picture above shows the shift in visuals when the spectrum and volume both have large values.