Program: 3D graphing calculator with symbollic differentiation
and simplification
author: Harleigh Chris Marsh
------------------------
description:
this program, takes in an expression and a differentation variable from the user, and then symbollically differentiates the expression, and, if the user chooses so, the program symbollically simplifies the differentated expression. Once the expression has been entered into the program, the user
can graph the expression, graph the derivative, and can graph both the expression and its derivative at the same time. The program places a different twist on how an expression is explored, the program implaments the standard change of x y and z axis to fit the function in the viewable window, but, the twist comes from the functionality of the program's 'camera' mode. In camera mode, the user explors the graphed expression, as if they were, themselves, inside the program, the camera functions as a standard 'first person shooter' camera, the user can move left, right, forawrd and backward, as well as levitate up, and dowm, and the 'looking' of the camera changes based on the movement of the mouse--ie: move the mouse to the left, and the camera 'looks' to the left, as if it was a person's head the user was controlling, and they are looking out of their eyes.
list of the main functionality of the program:
symbollic differentation of a general expression of n variables
symbollic simplification of a general expression of n variables
variables may be up to 30 characters long
2D graphing
3D graphing
graph a function
graph the derivative of a function
graph a function, and its derivative at the same time
change the drawing style and color of the function and its derivative
change the viewing window, the x, y, and z axis
change the level of detail for graphs (by changing the steping amount)
camera mode:
the user can explore the plotted function--either the function, its
dericative, or both the function and its derivative--as if they were
inside the program; the camera functions like a standard 'first
person shooter' camera
main benifits using this program:
the user is able to visually see a function and its derivative, this is
especially usefull for three dimentional functions
using the camera mode--see above for description of camera mode--the
user is able to explore the function--and its derivative--as if they
were inside the program, thus a very easy way to examine the graphed
function and its derivative; this way of exploring a functionis a
different twist to current mathematical graphing software
samples:
2D graphing of an expression, and its derivative:
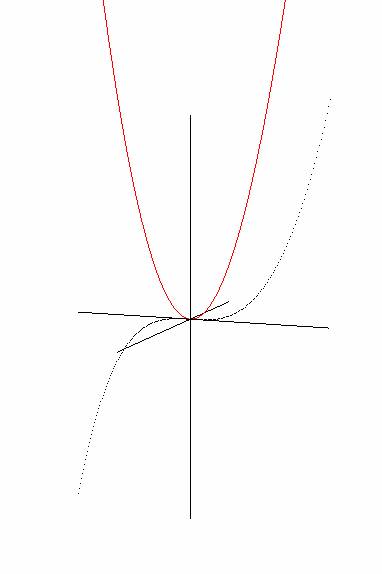
graph of x3 and its derivative, 3*x2
x3 is displaied as black dots, and 3*x2 is depicted as a red line
3D plot:
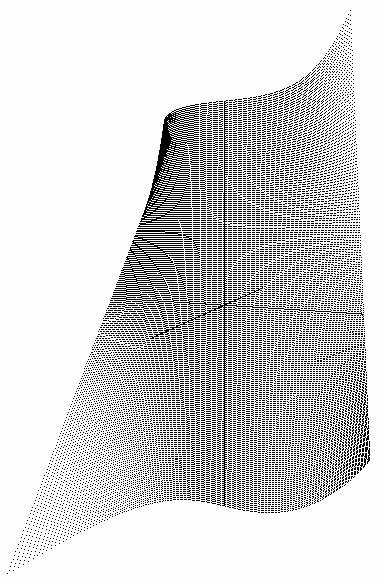
graph: x3y
3D plot of the derivative of x3y
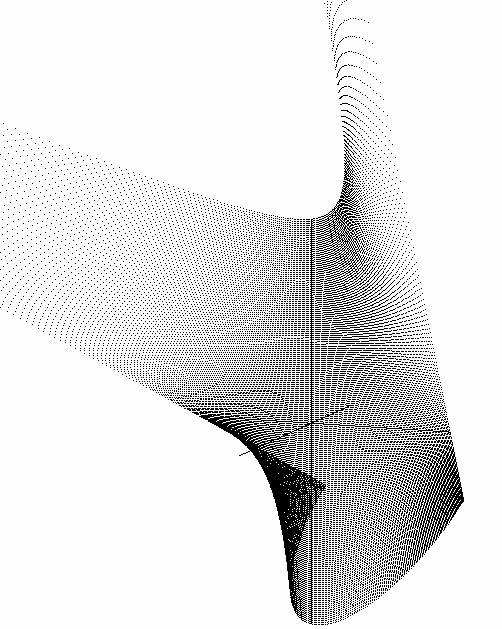
graph of the
derivative of x3y with respect to x
interesting 3D equation plot and its derivative:
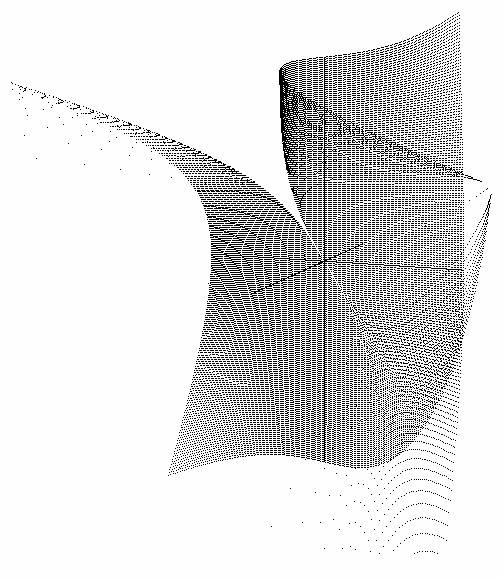
graph of (x3y2)/(x+y)
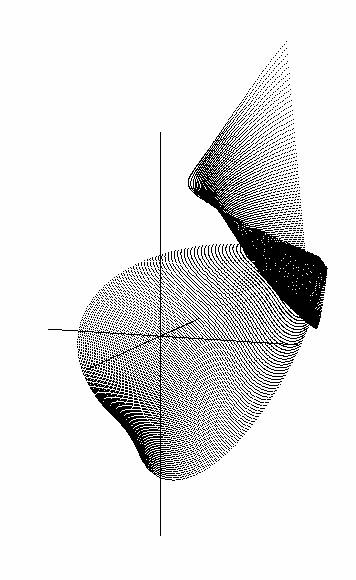
graph of the
derivative of (x3y2)/(x+y) with respect to x
symbolic simplification and differentation:
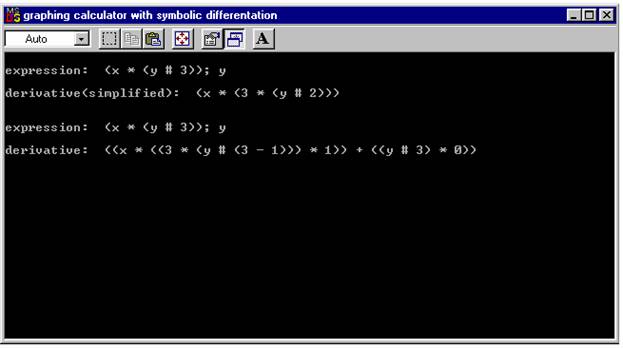
top expression: x*y3 differentiated with respect to y
and the simplified derivative
bottom expression: x*y3 differentiated with respect to y
and the unsimplified derivative
user's guide:
display a function and/or its derivative in the
view window:
note: to graph, use only lower case x and
y as the variables for the function
if a function has already been enteren into the graphing
calculator
then press the 'Clear' button once in the 'Equation' panel
1) enter the function into the graphing calculator
2) press 'graph f' button to graph f
press 'graph f'' button to graph f'
press 'graph f and graph f'' button to graph f and f'
optional 3) print the function and its derivative on the
console
optional 4) change the draw style and color of the function
and its derivative
optional 5) change the view window or the stepping amount
in x or y
6) to enter another function, clear the view window
and equation
to enter a function into the graphing calculator
1) type the function in the 'function' text field within
the 'Equation' panel
<function>;<derivative variable>
function => the function to be graphed and/or
differentiated
can contain n variables, each variable
can be up to 30 characters long
; => symbol that denotes the end of the
function
derivative variable => the variable which the
function is differentiated
by
derivative variable can be
up to 30 characters long
examples of legal expressions:
1/x; x
(7 + x*y)/(x+y); y
(apple#bananna - peach)/canalope; canalope
(a*b/c + 5)/7 + (x*y); z
2) press the 'Enter' button once
to print an equation and its derivative to the console:
1) enter the equation into the graphing calculator
2) press the 'Print' button in the 'Equations' panel
to change the draw style and color of the
function and its derivative:
to change the draw style of f:
in the f panel, select a style in the 'draw style'
combo box
to change the color of f:
in the f panel, select a color in the 'color'
combo box
to change the draw style of f':
in the f' panel, select a style in the 'draw style'
combo box
to change the color of f':
in the f' panel, select a color in the 'color'
combo box
change the view window or the stepping amount in x or y
1) change the x y and z axes as desired
2) press the 'Sync' button in the View panel once
to clear the view window and equation:
1) press the 'Clear' button in the 'Equation' menu once
field descriptions:
Equation panel:
this panel contains the functionality that is used to enter an equation into the 3D graphing calculator so it can be differentiated and, if the user chooses to do so, graphed in the viewing window
'function': enter the function to be graphed or symbollicaly
differentiated
'enter': enters the equation into the graphing calculator
'print': prints the equation, and the derivative of the
equation, to the console
Note: if 'Simplify Equations' in the 'Options panel'
is checked, the derivative is symbollicaly
simplified before it is displaied on the
console--see 'Options panel' below
'clear' clears the equation entered in the graphing calculator,
clears the viewing window of any graphed functions
Graph panel:
this panel contains the functionality to graph and display
f and f' on the viewing window, as well as to change the
display properties of the graph of f and of f'--ie: color,
draw style of the function,...
f panel
'draw style' draw style for function f
points draw f as points
dashes draw f as dashes
line strip draw f as a single line strip
'color' color style for function f
f' panel
'draw style' draw style for function f'
points draw f' as points
dashes draw f' as dashes
line strip draw f' as a single line strip
'color' color style for function f'
'graph f' graph function f in the viewing window
'graph f' ' graph function f' in the viewing window
'graph f and graph f' '
graph both function f and f' in the viewing
window
View panel:
this pannel contains the functionality to change the viewing
window for the graphed functions
X min minimun x value
X max maximum x value
X step x distance between sampling points
Y min minimun y value
Y max maximum y value
Y step y distance between sampling points
Z min minimum z value
Z max maximum z value
'Reset' reset the view window to the original dimentions
'Sync' redraw the graph based upon the current view window
dimentions and stepping amounts
Camera panel:
this pannel displays information on the camera mode functionality
of the program
c: press the 'c' key on the keyboard to toggle the camera mode
on and off--see 'State' below
u: when the camera mode is off--when 'State' displaies 'off',
see below--press the 'u' key on the keyboard to reset the
default position of the camera
'State': displaies whether the camera mode is on or off
'on' => camera mode is on
'off' => camera mode is off
Options panel:
this pannel contains various options of the program
'Draw Axes' on (check mark visible) => draw the axes
off(no check mark) => do not draw axes
'Simplify Equations'
on (check mark visible) => run the simplification
algorithm on the
derivative of the
equation
off(no check mark) => do not simplify the derivative
of the equation