Multi-Chart Geometry Image Rendering with
Bow-Legged Iterative Chart-Boundary-Straddle Hole
Stitching Method
AKA
Hole Filling Multi-Chart GIM’s
By Stephen Brown and Pete Lawrence
Abstract
Geometry images offer a way to re-mesh a surface using a regular sampling of vertices. Easy reconstruction, down-sampling, and efficient traversal are a few benefits of using a geometry image. Creating a geometry image involves parameterizing the surface into a square-planar domain and re-sampling the surface on a regular grid. Although this offers the benefits previously mentioned, it can lead to distortion of the original surface. Another type of geometry image called a multi-chart geometry image can be used to cut down on the distortion, while still allowing the benefits of geometry images in general. Creating a multi-chart geometry image involves cutting the surface into several pieces called charts before parameterizing to the planar domain. Multi-chart geometry images, however, cause cracks between charts in the re-meshed surface. The goal of our project is to fill the cracks in the re-meshed surface that were created by the multi-chart geometry image. To fill the cracks we implemented our own stitching algorithm that is similar to zippering. The main difference between the two is that while zippering distorts faces to fill cracks, stitching creates additional faces. This results in a watertight re-meshed surface with less distortion in areas where cracks used to exist.
Images
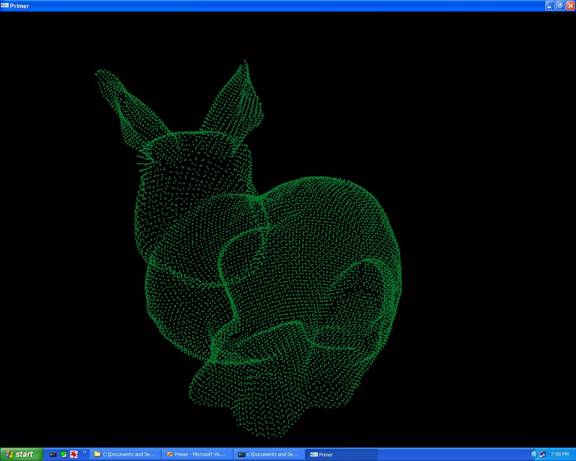
Point cloud generated from the geometry image.
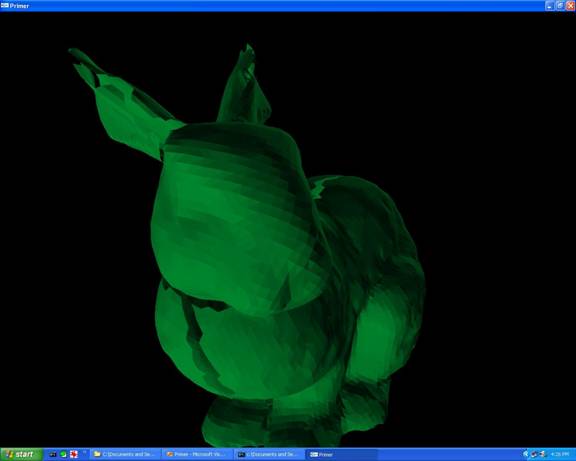
Original re-mesh with cracks between the charts.
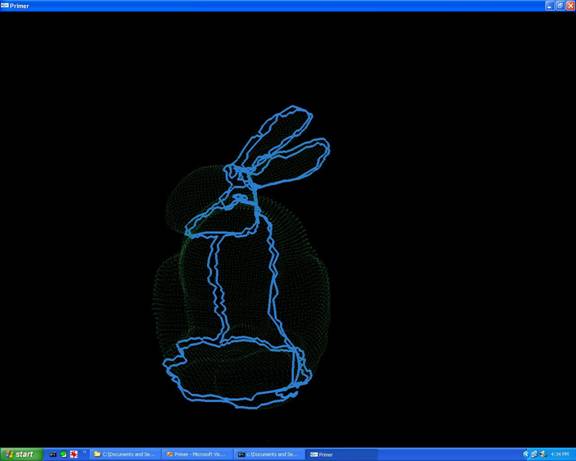
Original re-mesh with chart boundaries shown in blue.
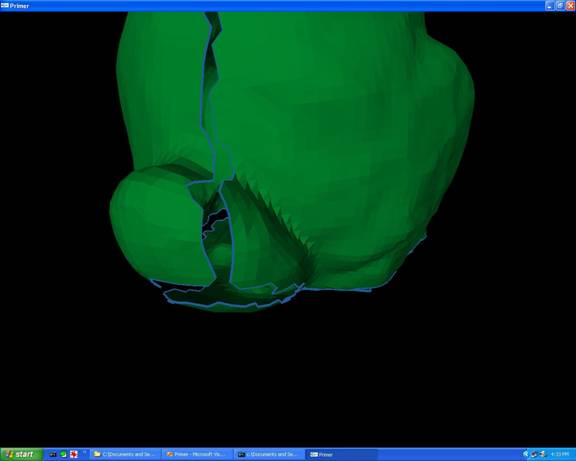
Crack between three different charts.
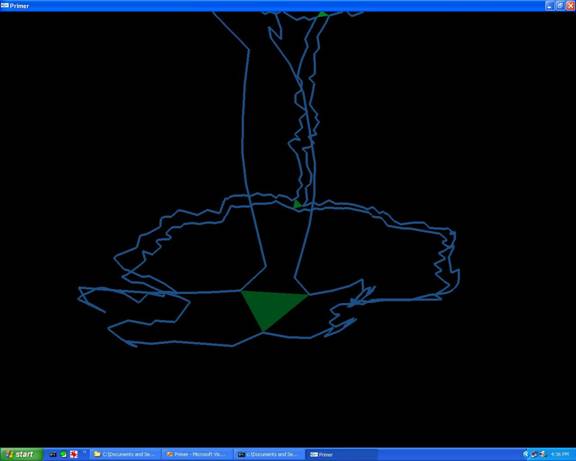
Seed triangle connecting three different charts.
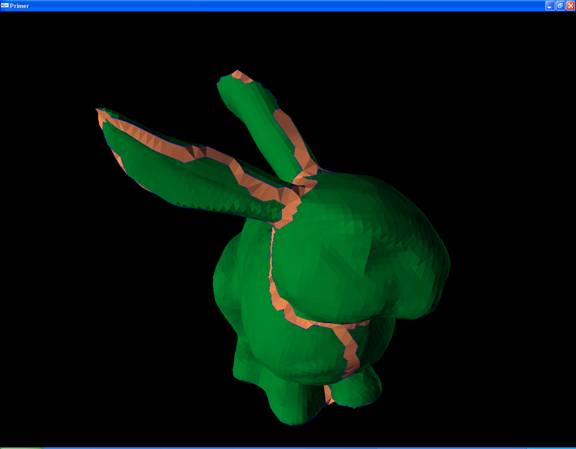
Charts connected with new triangles.
User Guide
*Make sure bunny_lowres_c8.gim is in your working directory
before starting the executable.
Space bar – stop
rotation
1 – display point cloud
2 – display original triangle mesh
3 – display chart boundaries
4 – display shortest edges between charts
5 – display crack filling triangles
6 – display normals for crack filling
triangles
7 – no function
8 – display next boundary points to be triangulated
9 – toggle lighting mode for point cloud only
0 – toggles hole filling process
m – toggles hole fill color
**Any combination of
the above can be displayed at once. So
to see the final bunny with holes filled use setting 2, 5 and 0 in combination.