Project Goal: Measure the error introduced by VRIP’s processing of aligned range images.
Project Description: For this project we produced synthetic range images from datasets. We, then, sent those images through VRIP to see if VRIP introduces any topological or geometric changes. We measured geometric changes using a method similar to the method Garland uses in his paper Surface Simplification using QEM.
Synthetic Range ImageAcquisition: To generate the synthetic range images we used OpenGL. We will rendered the model in OpenGL and set up the camera for an appropriate view of a range image. Then we used the screen coordinates and the z-buffer values along with the projection matrix, the modelview matrix and the viewport matrix to calculate the points for the range image. This was accomplished by using the gluUnProject() function. A linux binary for the program is found here. The program expects one parameter, the name of an ascii ply file representing the model. To capture a range image, set up the camera using w, s, a, d to move, and the mouse to rotate. Press + to remove the axis, and then c to create a range image. The range image ply file will be written to stdout.
VRIP: VRIP is a package for merging sets of range images into a volume. Each range image is represented in a .ply file as a set of vertices and a range grid along with a header. The range grid indicates what points were seen along the line of site of the sampling grid. VRIP takes in a configuration file that contains the range image names along with their transformations in the form of seven floating point numbers. The first three points are the translation of the image and the last four are the quaternion representing the rotation. VRIP then merges these range images into a surface. Further documentation on VRIP can be found here.
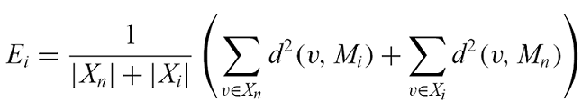
Error Measurments: In order to measure error between the original range images and the VRIPed range images we used a method that Garland uses in his paper “Surface Simplification Using QEM”, which is also similar to the Edist energy term used by Hoppe. This metric takes in two meshes. It calculates the shortest distance form a point on mesh 1 to a face on mesh 2. This calculation is done for all the points in mesh 1, then the results are summed and squared. The same thing is done for the points of mesh 2 and the faces of mesh 1. The summation of the two numbers is then divided by the summation of the number of vertices of the two meshes. The algorithm is below and the code for this program, which takes two meshes as inputs is found here. (Call the function in command line with finalProjCalcError.exe file1.ply file2.ply)
Problems with what we have and Potential Future Work
1) Range images do not align correctly. We are not sure what we are doing wrong, wheather our range images have errors or our config files have errors, but we can only align range images that were taken with the camera in the xz plane. When a y component is introduced, the VRIP generated surface gets screwed up.
2) Because of 1, our surface is not watertight, so we cannot run the genus calculation on it, if we wanted to use the genus to analyze our surface.
Lessons Learned
1) If you’re relying on other sources, make sure they have good documentation for their software.
2) Don’t focus on one detail of your project, because other details could be problems as well. For example our error calculation took a very long time to run, and we were not expecting that, we wasted a lot of time trying to get VRIP to work correctly.
3) A lot of things that have to do with graphics take a long time to run, so saving time for that is important.
Results
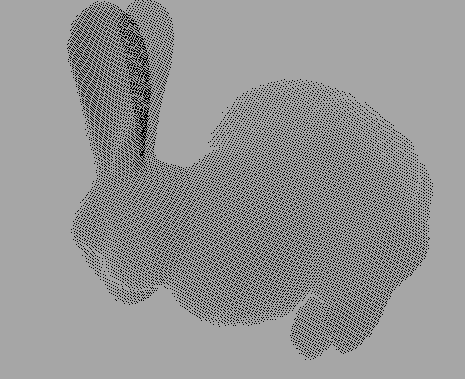
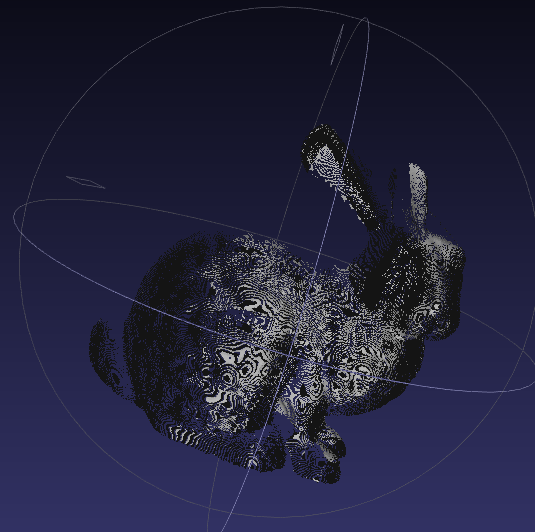
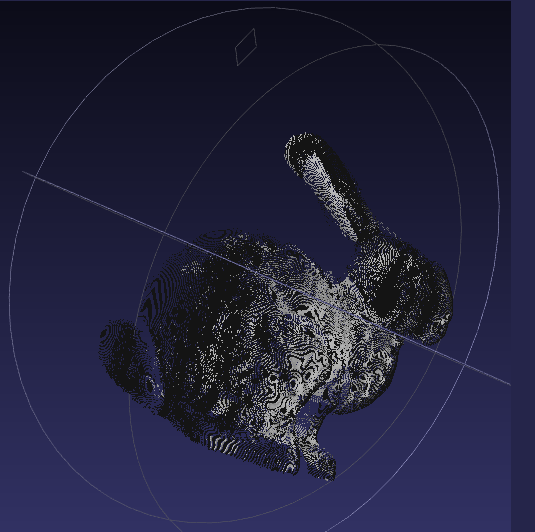
Our program generates range images. However, due to the lack of documentation on VRIP, we are still having errors generating a surface. The alignment of the images works fine when the camera is on the xy plane. When we add in a y component, the rotations are incorrect. Therefore, our surface is not complete as seen in the images below. However, we will run the error metric on our surface and the surfaces provided by Stanford of the bunny data. We will calculate the error between our surface, bun.ply and the Stanford surfaces bun_zipper.ply, bun_zipper_res2.ply, bun_zipper_res3.ply, bun_zipper_res4.ply. We generated one mesh, bun.ply, from range images we synthetically aquired from the bunny. The different bun_zipper ply files are the files of the Stanford bunny done at different resolutions.
| Surface to Compare bun.ply to | Error |
| bun_zipper_res4.ply | 89.163139 |
| bun_zipper_res3.ply | 4.7145 |
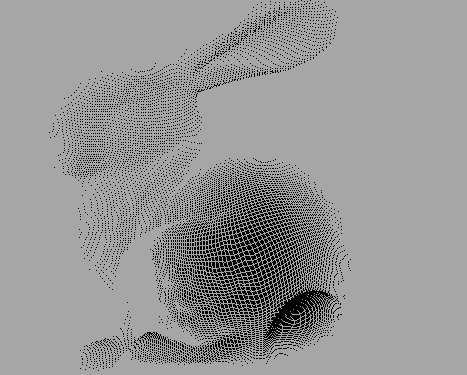
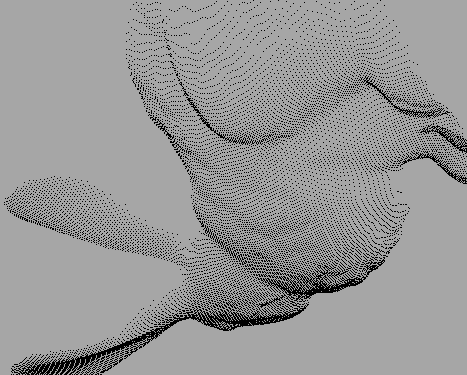
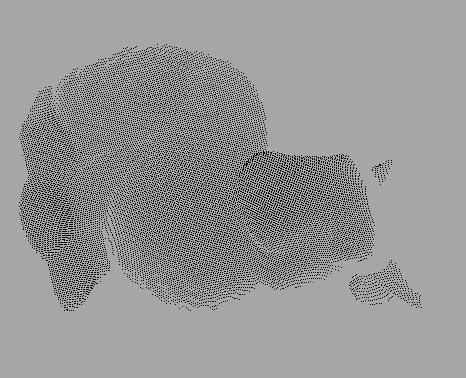
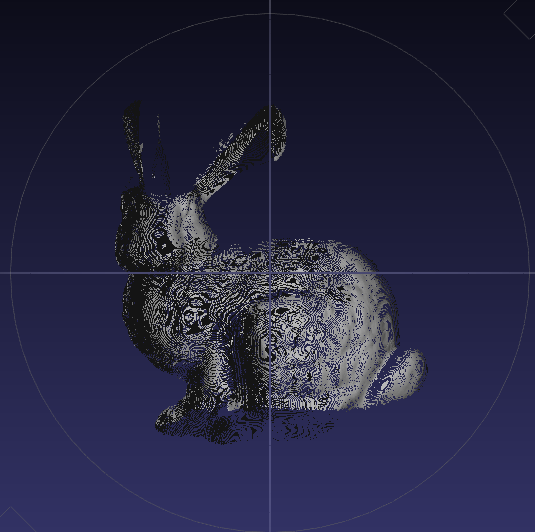
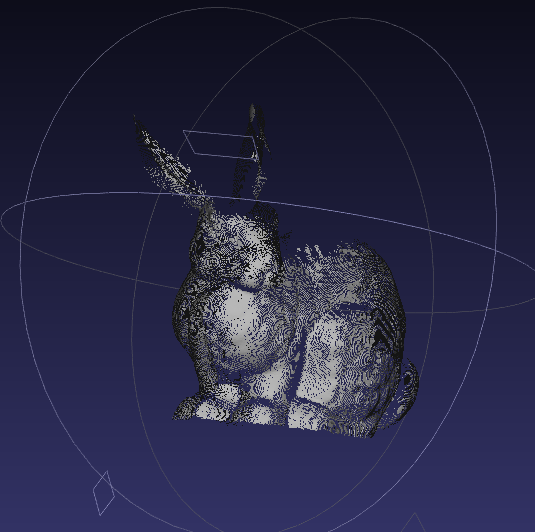
Results of Synthetic Range Image Aquisition
These results were obtained from the program that acquires range images.
 |
|
 |
 |
Results after VRIP reconstruction
 |
 |
 |
 |
References
VripPack: Volumetric Range Image Processing Package, http://graphics.stanford.edu/software/vrip/
Garland, Michael; Hckbert, Paul. Surface Simplification Using Quadric Error Metrics. http://graphics.cs.uiuc.edu/~garland/papers/quadrics.pdf
The Stanford 3D Scanning Repository. http://graphics.stanford.edu/data/3Dscanrep/
Cignoni, Paolo. MeshLab. http://meshlab.sourceforge.net/