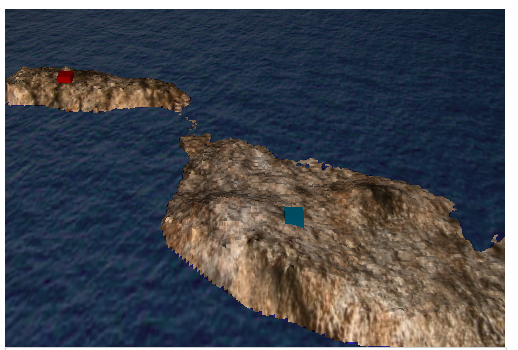
The project goal was to create a 3D interactive visualization of a map of Malta with cistern locations and visualizations.
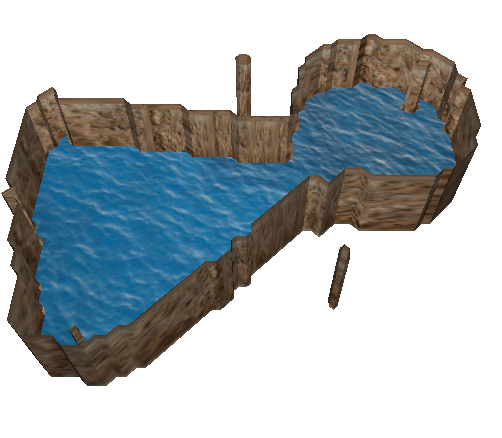
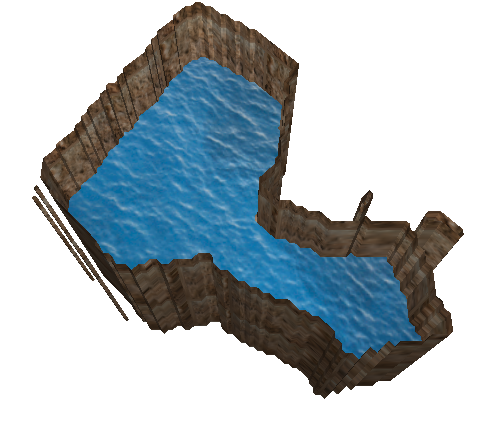
A cistern is an underground water storage system used to collect rainwater, and they are common throughout Malta.
The data for the map of Malta was obtained using latitude and longitude coordinates. The cistern locations were taken from the ICEX
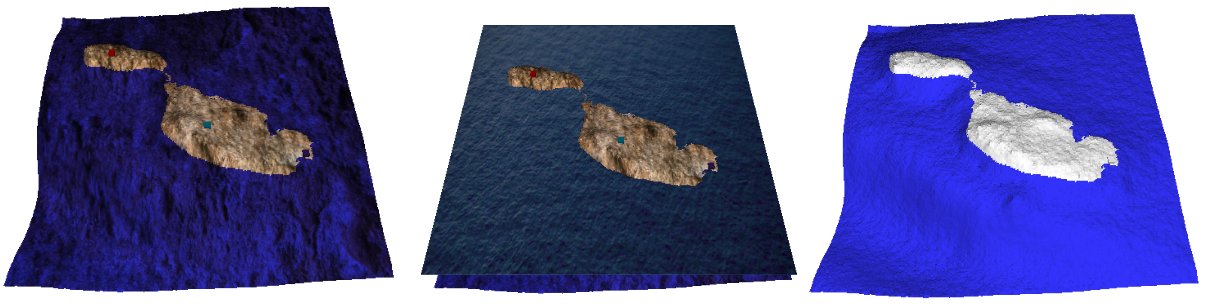
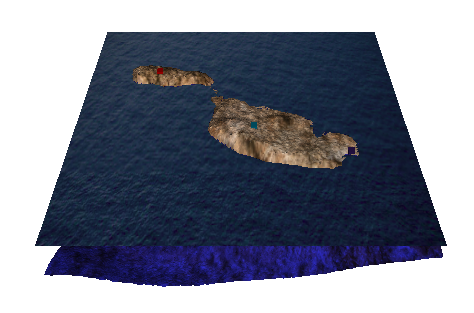
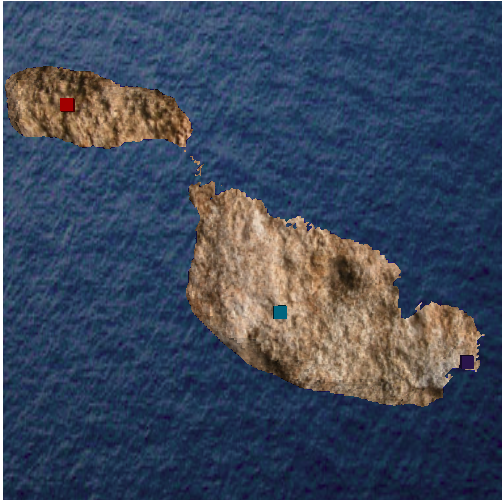
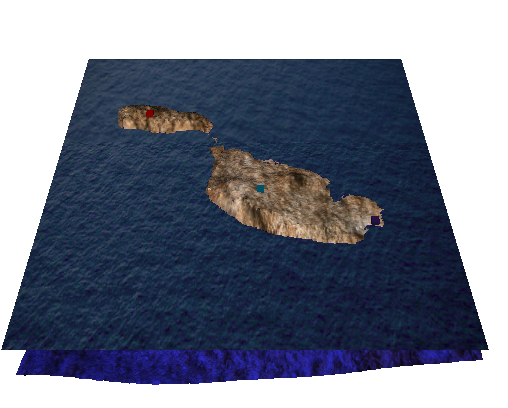
2012 team during their deployments in Malta. The cisterns displayed on the Malta map are represented by red, purple, and blue markers.
The cisterns shown have recorded GPS data and are located within Malta.
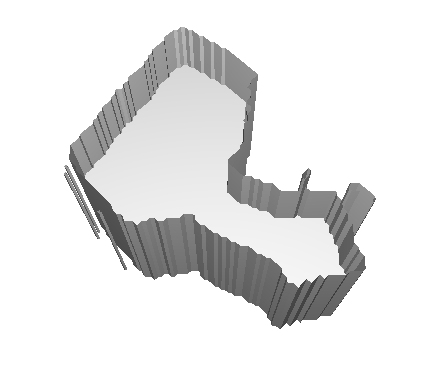
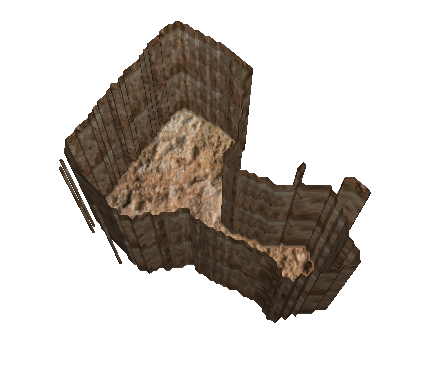
The project is written using WebGL and JavaScript. Obj files containing the GIS data and the vertex positions of the cistern are loaded into
the program. Features in the interaction include switching between cistern models and the map of Malta, zooming in and out, and rotating.
Within the map of Malta, the user can view the different locations of the cisterns within Malta. The color of the cistern is displayed in the
selection menu. The underwater parts of that included in the GIS data are displayed using chromatic translations deepening the blue shading.