MR is metabolic rate in watts;
w is subject weight in kilograms;
l is load carried in kilograms;
v is walking speed in meters per second;
g is grade in percentage,
t is terrain factor (e.g., 1 for treadmill walking).
Andrew Tsui
CSC 572
The focus of this project was to provide a means of visualizing and interacting with Graphical Information System (GIS) terrain data. Visualization was accomplished through the use openGL and a custom data structure that allowed the raw GIS data to be stored and manipulated internally to produce a visually appealing representation of the GIS data. Interaction was accomplished by allowing the user to select random points on the terrain to determine paths of least resistance between the points. For this project, a path of least resistance is defined as one that takes the minimal amount of caloric energy to traverse while also obeying natural landmarks (such as lakes or rivers).
GIS data generally does not provide detailed information, such as the presence water, about the terrain that it represents. However, through analysis of the data, it is possible to infer the likely locations of water on the terrain. This project conducts this analysis so that the paths that are generated will respect these landmarks and avoid crossing them if another path is available.
To generate a path with the least caloric cost, the following equations were used:
MR is metabolic rate in watts;
w is subject weight in kilograms;
l is load carried in kilograms;
v is walking speed in meters per second;
g is grade in percentage,
t is terrain factor (e.g., 1 for treadmill walking).
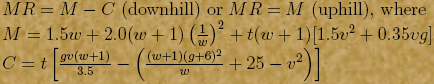
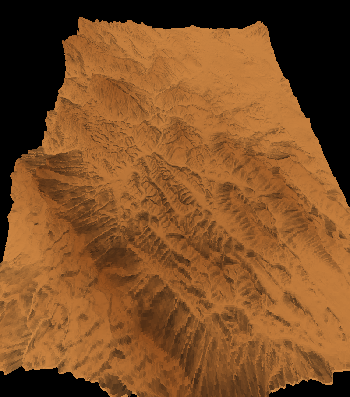
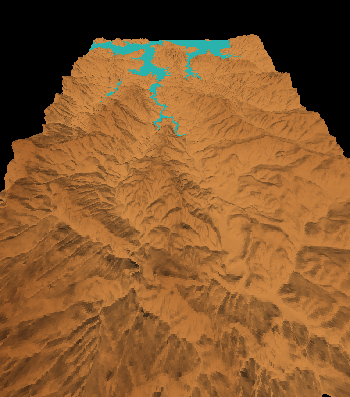
Below are three terrains that were visualized using this project. From left to right they are: Atascadero, Lake Nacimiento, and San Francisco:
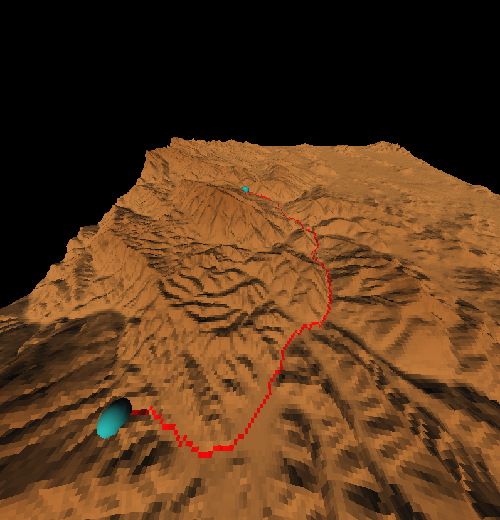
The user is able to click directly on the terrain to select where they would like to travel. Below is an example of a path generated by the program. Notice how the path follows the ravine rather than walking across the mountain range:
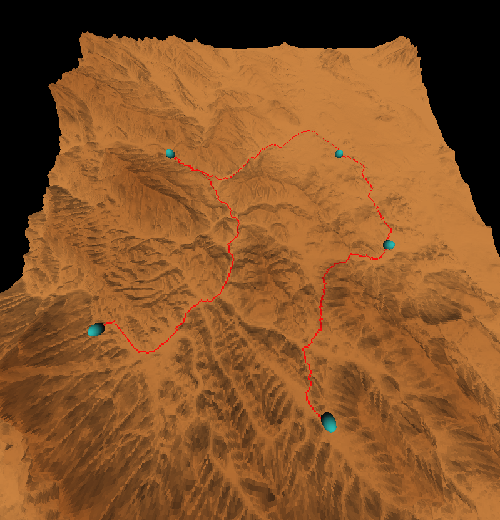
If multiple points are selected, the path generated will travel between the points in the order they were selected:
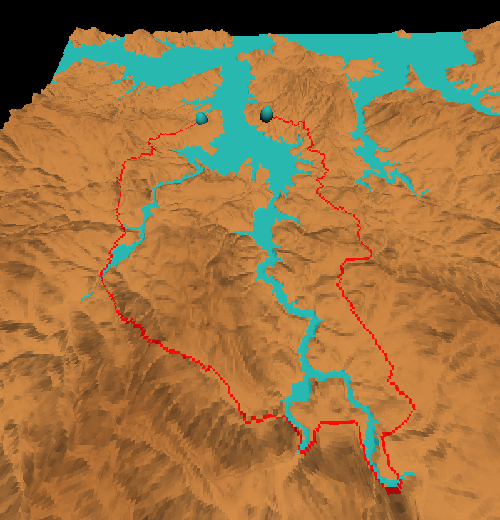
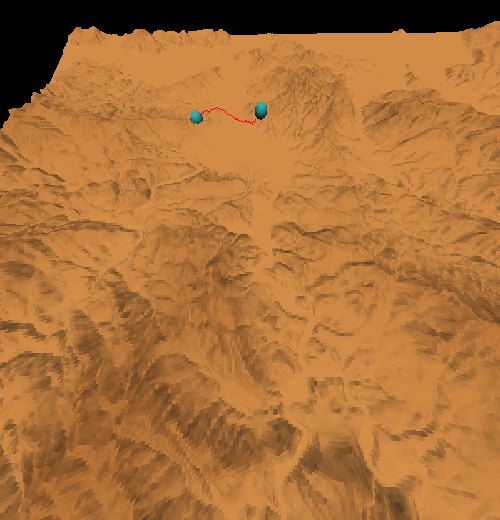
As mentioned before, the paths will respect natural landmarks such as lakes. The screenshots below show the same starting and ending points on the Lake Nacimiento terrain. The screenshot on the right has the water disabled:
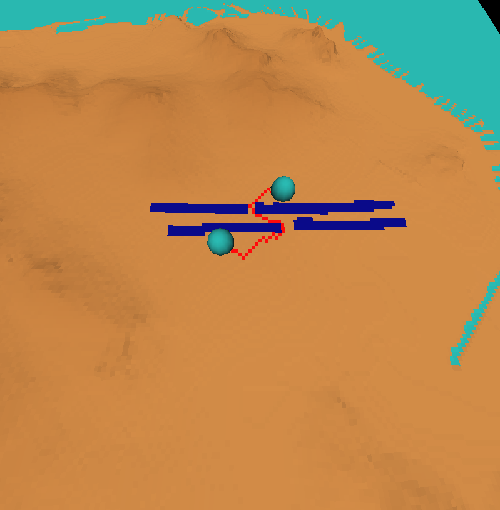
The user is also able to "paint" directly onto the terrain to indicate areas where the path should not traverse. The dark blue regions in the screenshot below indicate where the user has painted:
GIS Data (DEM Format)
GIS Data Parser
DEM Format Specification
Brian Wood's Thesis: Energetically Optimal Travel across Terrain
Jason Rickwald's Thesis: Continuous Energetically Optimal Paths Across Large Digital Elevation Data Sets