CSC 572 Final Project under Professor Zoë Wood
Designed by
California Polytechnic State University
Using Geographical Information System (GIS) data, we can can calculate the fuel and energy efficiency over a given terrain. Users are able to input two points upon a terrain in which a direct path, the small fuel consumption path, and the smallest (potential) energy path (based on a 1325 kg Toyota Prius) will be drawn. The program takes in parameters such as the maximum grade, the fuel consumption equation, and basic physics to calculate the data. The goal of the program is to help others, such as Civil Engineers, be able to visualize the terrain data for transportation planning purposes.
| Fuel Efficient Path Images | Energy Efficient Path Images |
|---|---|
|
|
|
|
|
|
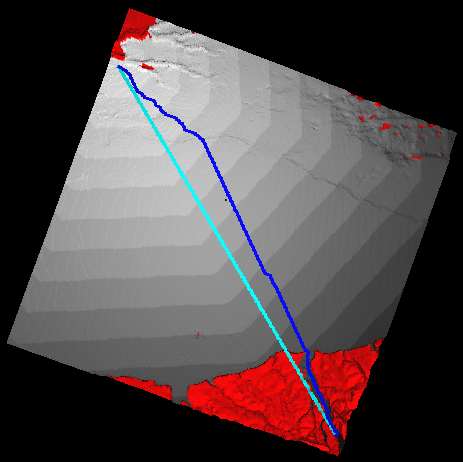
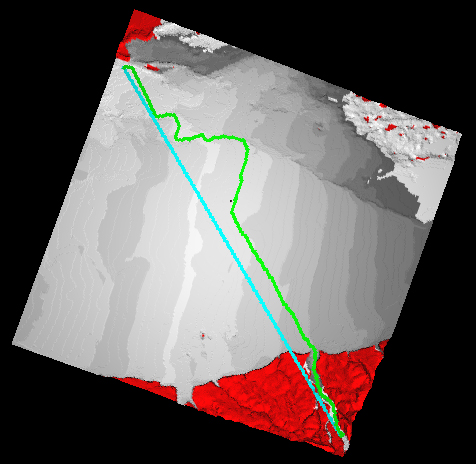
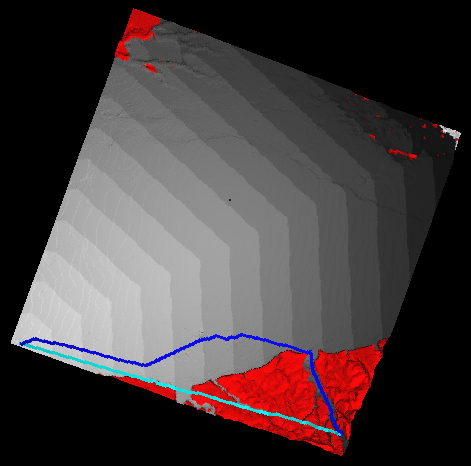
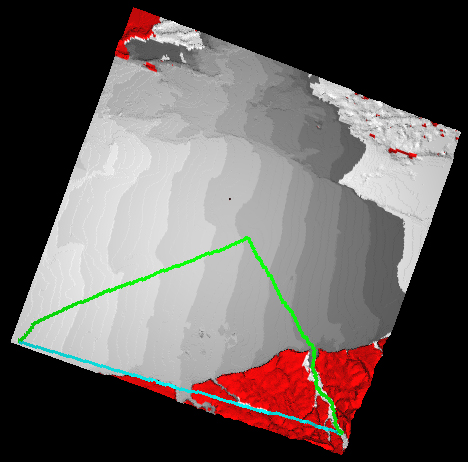
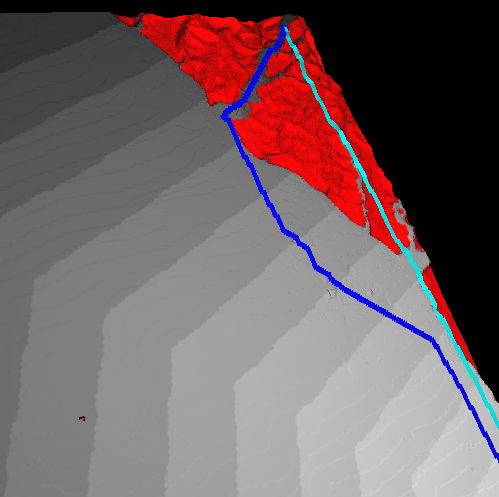
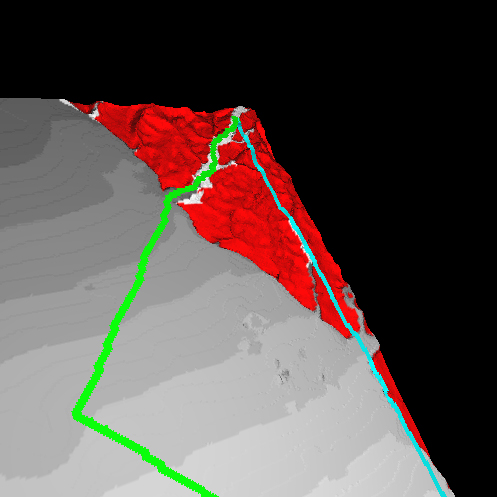
The images shown here are of a portion of Santa Maria, California using the GIS data provided. Previously, I also worked on Yosemite Valley and Atascadero but the mountainous terrain had made calculating paths very difficult. The images follow the same layout in that each row represents the same starting and ending points for each corresponding type of efficient path column.
Red: Terrain that can not be traveled upon because of maximum grade.
Cyan: Direct path from the source point to the ending point. In better words, creating a tunnel straight through the terrain.
Blue: Fuel efficient path from the source point to the ending point. The parameters uses the speed and the distance traveled as parameters.
Green: Energy efficient path from the source point to the ending point. The parameters uses the 1325 kg Toyota Prius and elevations as parameters.
Gray Shadings: Increments from the source point depending on the view mode. For example, the image with a blue line indicates that through each gray shading as for each 1000 meters from the source point.
White: The part of the terrain that has not been colored for visualizing purposes.
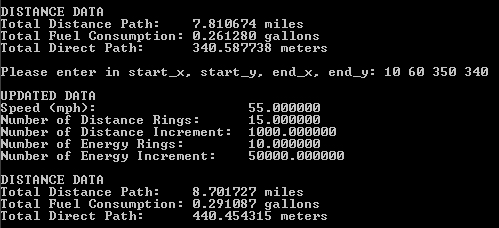
As seen under Command Prompt Window, the following are the options in which user can use to interactively work with the given data.
Hold down 'w': Moves forward.
Hold down 's': Moves backward.
Hold down 'a': Moves left.
Hold down 'd': Moves right.
Hold down 'r': Moves up.
Hold down 'f': Moves down.
'm': Toggle switch between fuel efficiency mode and energy efficiency mode.
'p': Input into the command prompt window the starting x and y coordinates and ending x and y coordinates.
'P': Print into a text file of the same folder containing the raw distance table from the starting point, the previous vertices table from the ending point for the fuel efficiency and energy efficiency path.
'S': Increase the speed for fuel efficiency.
's': Decrease the speed for fuel efficiency.
']': Increase the number of rings (gray shadings).
'[': Decrease the number of rings (gray shadings).
'}': Increase the increment (100 meters or 50,000 joules) for each ring.
'{': Decrease the increment (100 meters or 50,000 joules) for each ring.
'x': Moves left on the x-axis.
'X': Moves right on the x-axis.
'y': Moves down on the y-axis.
'Y': Moves up on the y-axis.
'z': Moves away on the z-axis.
'z': Moves towards on the z-axis.
'-': Decrease rotatational theta increment.
'+': Increase rotatational theta increment.
Mouse Left Button Click: Rotate to the x-axis.
Mouse Middle Button Click: Rotate to the y-axis.
Mouse Right Button Click: Rotate to the z-axis.
Mouse Click and Drag in the Middle: Move to look left, right, up, or down.
Mouse Click and Drag in the Corners: Move to roll the camera.
It looks good. It looks like you covered the basic topics and the next step would be to get into much more detail about design requirements, but that would be very detailed. The program appears to give a good initial step that gives a general idea of what a path might look like, but that path will likely change some during design based on certain requirements. I would say for improvements would be just more detailed inputs and outputs.
The project was well done. This is a great tool to plan new roadways that account for reducing energy use and fuel consumption to help California meet the goals of AB 32. Future improvements to the program could take right-of-way constraints and geometric constraints such as horizontal and vertical curves into account. Overall, it is a great start!
Path Geometric Constraints: This concern the horizontal and vertical curves that would be based on safety constraints. For example, horizontal constraints on curved would be based on speed such as cars traveling 25 mph need a curve of at least 200 feet radius.
Interactive Mouse Click: Use the mouse to click on the terrain to indicate the starting and ending points for the paths.
Interactive Camera View: The camera is able to view the terrain up close and personal without presently lagging.
GIS Data Input: Any GIS data can be an input to be easily parsed and display.
Executable File - Could require libraries such as glut to be installed on local computer.
C++ and Header Source Files - Requires libraries such as glut to be used for compiling.
California Department of Transportation (Caltrans) Highway Design Manual on Maximum Grades
I want to extend my thanks to Professor Zoë Wood of the Cal Poly Computer Science Department for providing the help, support, and challenge throughout this project. I like to thank my Cal Poly Civil Engineering Alumni, Tony Henderson and Gregory Ripa, who inspired my interests in Civil Engineering and assisted with the calculations of fuel consumption. I like to also thank you Professor Ed Sullivan of the Cal Poly Civil Engineering Department for providing insights to parameters of fuel consumption. And lastly, but not the least, I like to thank John Allwine, Kyle Haughey, and Harrison McKenzie Chapter for providing advice and code to display list and interactively camera view the terrain through a mouse click and drag.