This project was inspired by Gource, an OpenGL-based source code visualizer.
GitTree is a WebGL-based 3D version. The git commit log of a source code
directory is parsed via Python script and turned into a JSON representation. The
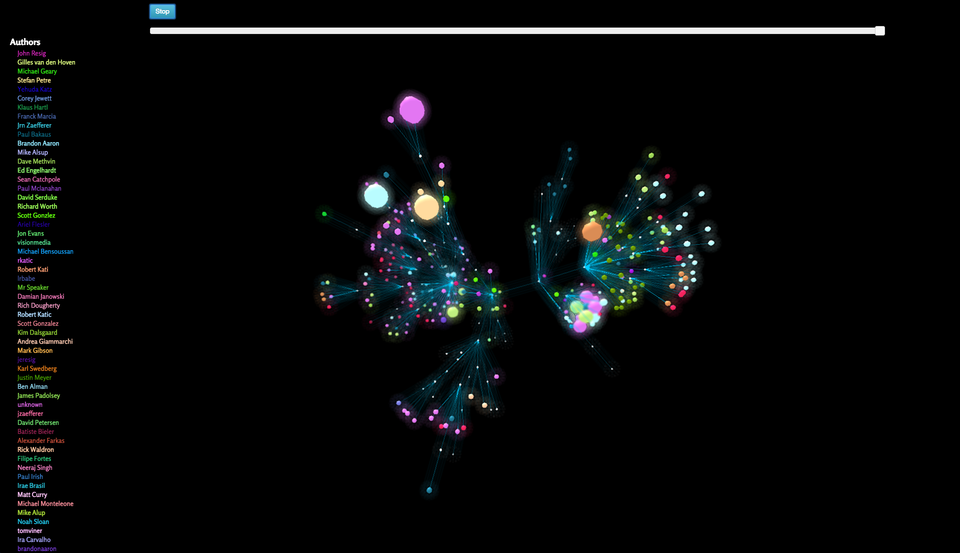
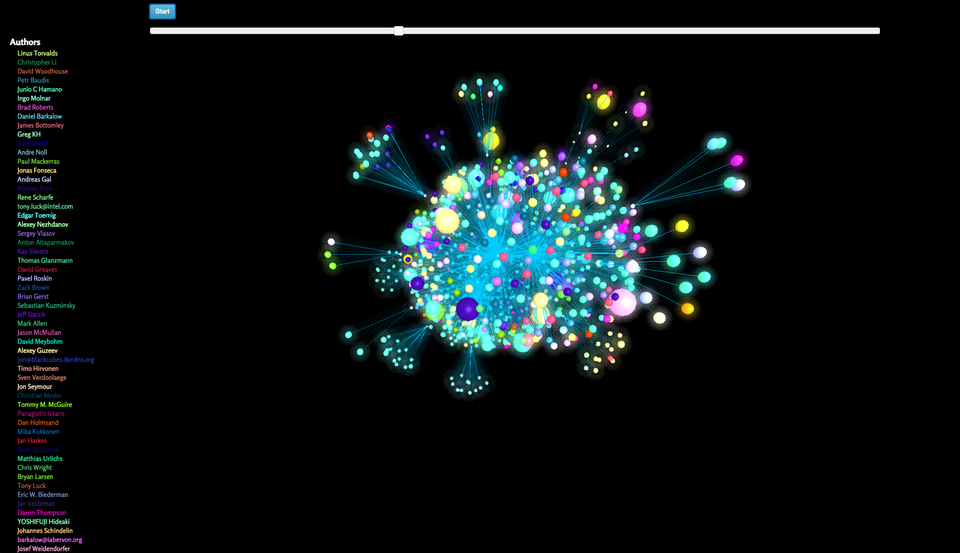
GitTree web application takes that JSON and creates a 3D force-directed graph of
the source code. Leaf nodes of the graph represent source code files. Their
sizes are proportional to the sizes of their related files. Their colors
represent the most recent commit author. Each commit author is designated a
randomly-chosen color. As GitTree iterates through the commits, it updates the
graph with new nodes for newly-created files, updates existing nodes' colors and
sizes to represent file changes in each commit, and removes nodes for deleted
files. Edges designated directory hierarchy and white parent nodes represent
folders.
The graph is displayed in the middle of the screen. The list of commit authors
is shown on the left. At the top is a Start/Stop button and a slider
representing the graph's progress through the commit log. These controls are
used to move forward or backward through the commit log. The user hold the left
mouse button down and rotate the graph in all directions. The user can hold the
right mouse button down to move the camera up, down, left, or right. Finally,
the user can use the mouse scroll wheel to zoom the camera in or out. A bokeh
shader is to blur the entire graph in proportion to the camera's zoom level.
A force-directed graph determines placement of nodes and edges by simulating
physical forces.
Edges are implemented as springs. The movement of the springs is determined via
Hooke's law, which states that the force required to stretch a spring is
proportional to the desired stretch distance.
Nodes are given an electrical charge that causes them to repel each other. The
placement of nodes is determined via Coulomb's law, which states that the force
between two nodes is equal to a k constant multiplied by the quantities of the
nodes' charges, divided by the squared distance of separation between the two
nodes.
To obtain a stable system an overall drag force is applied to the entire graph
to slow the movement of nodes and edges.
Body forces are calculated using a Barnes-Hut simulation. The graph is
subdivided into an octree to group nearby components of the graph into bodies.
This results in a n * log(n) calculation time instead of an n-squared
time.
The force-directed graph implementation is provided by Andrei Kashcha's
``ngraph'' project. Ngraph provides a hook into Three.js, a Javascript WebGL
library.