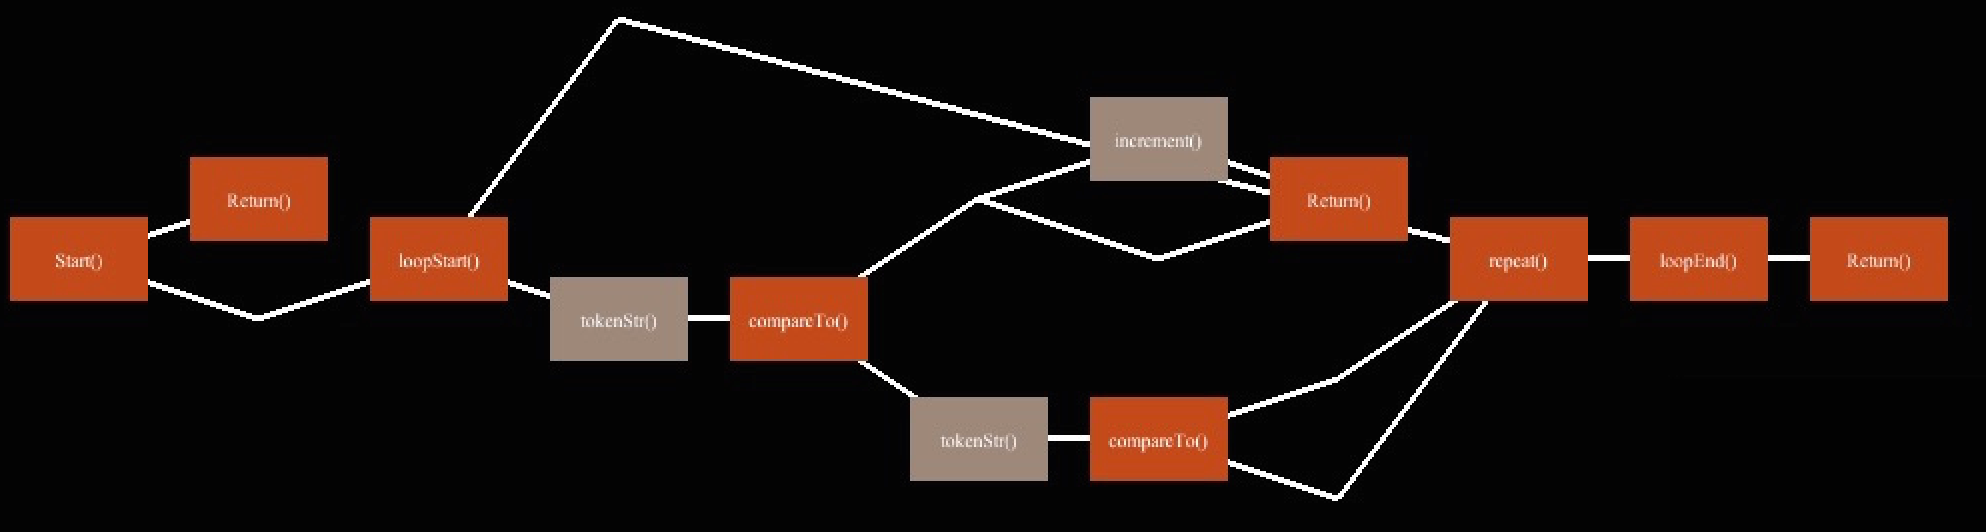
My masters thesis involved building a system which generates visualizations of input java programs. It shows all possible paths of execution throughout a given method through a graph based approach. In the graph nodes represent method calls and edges represent possible paths through the method. It produces images like
the one shown below.
If you think that this is an awesome idea, but that picture looks really ugly, than this is the project for you. If you don't think that, you should keep reading anyways.
This project focuses on beautification of my thesis through curves. Additionally a couple of additional layouts will be explored.
Curves
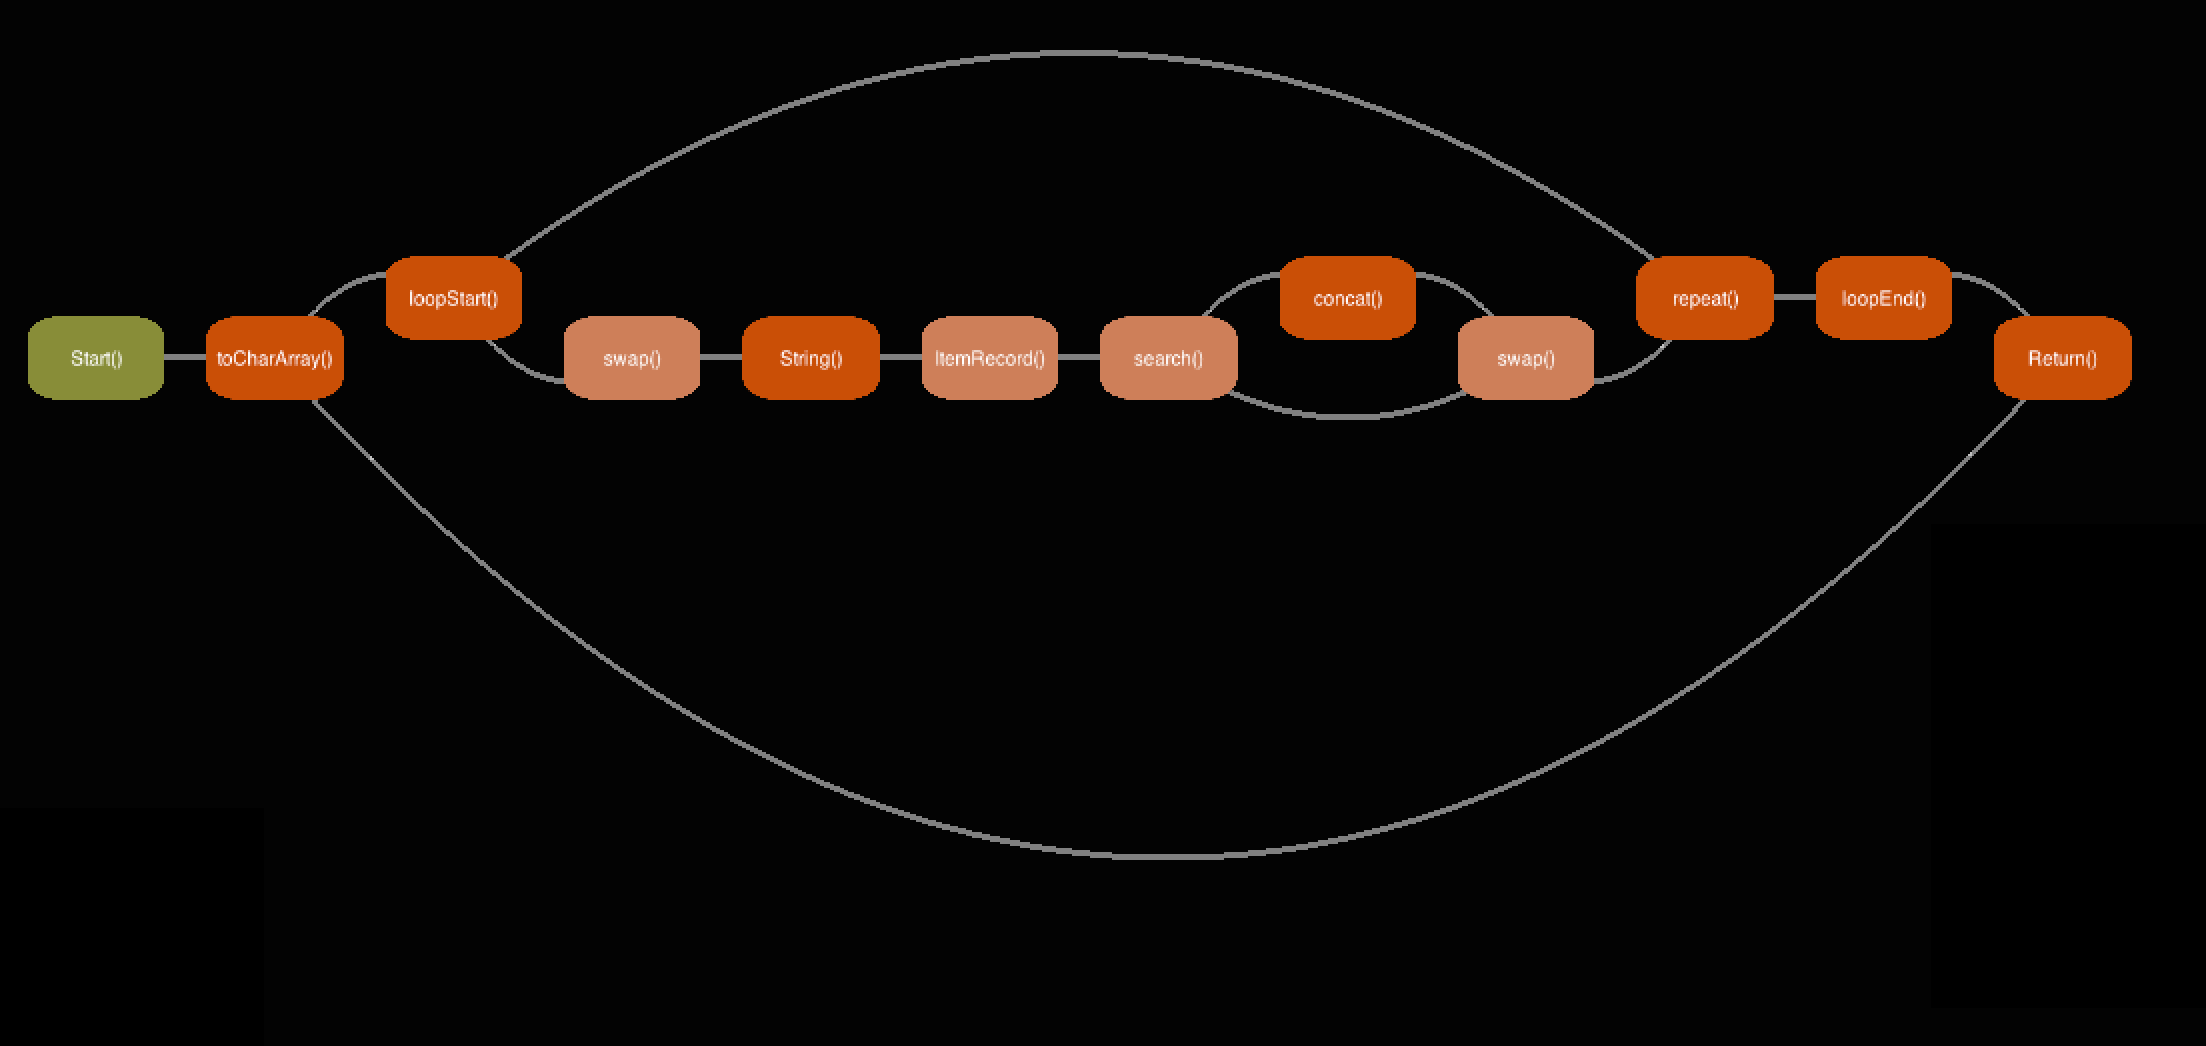
Let's cut right to the chase shall we?
Well that looks a lot better, but how the hell did you do it Taylor? Lets talk about the nodes first, they're actually exactly the same geometry as before. There has now been an alpha mapped texture applied which makes it look as though we have nice rounded boxes. Additionally some transparency has been applied to the edges to make it slightly more pleasing to the eyes.
But clearly the major difference lies in the curved edges. These edges are generated using a quadratic spline system. Since we are only desiring to build a simple arch from one node to another, all we need is 3 points, start and end with a control point in the middle to bend around. This control point is computed by finding the directional vector pointing from start to end and calculating its perpendicular vector. Then go to the middle point of start and end and travel along the perpendicular vector for a distance based on the distance between start and end. With the control point placed we can now solve for a quadratic equation which passes through all 3 points using a matrix inversion. We then draw line strips along this curve which openGL will smooth for us to make nice looking curves.
This is all fine and dandy you say, but there's no way you could make a cool looking animation which follows a specific path through the program. Wrongo!
Lines
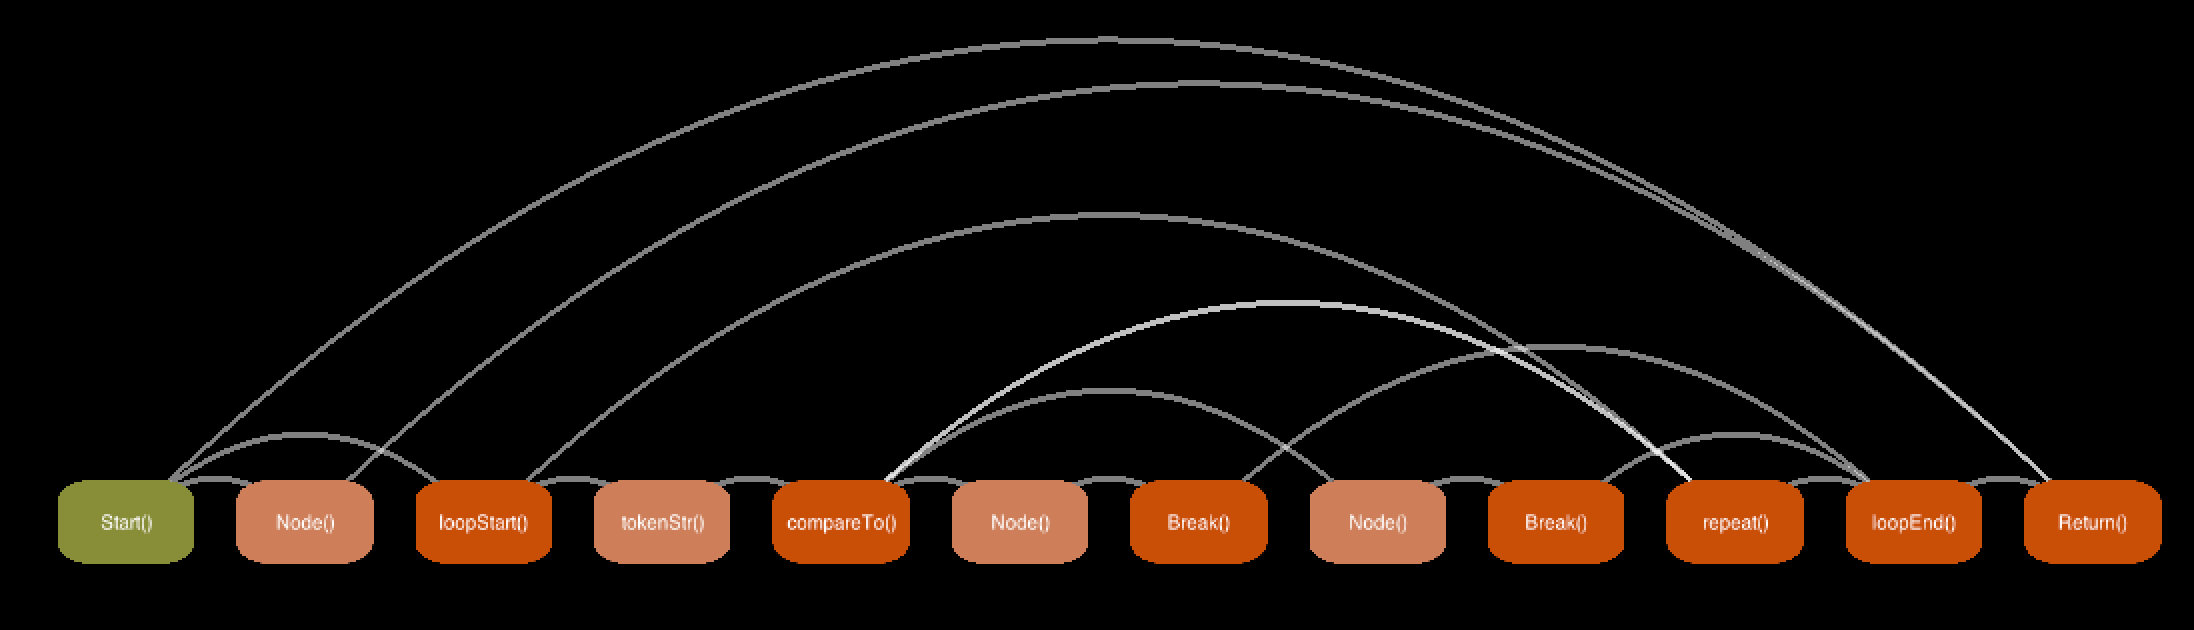
In addition to all this stuff making the graphs more beautiful, we decided to see what would happen if the graphs were layed out differently. What you've seen above is referred to as the branch layout. Now I'll show the linear layout.
This layout loses the ability to easily track branches in code, but does make it very easy to see nodes where multiple branches converge. Additionally this layout may be helpful in comparing different implementations of the same function, as you could easily stack these graphs on top of each other.
Circles
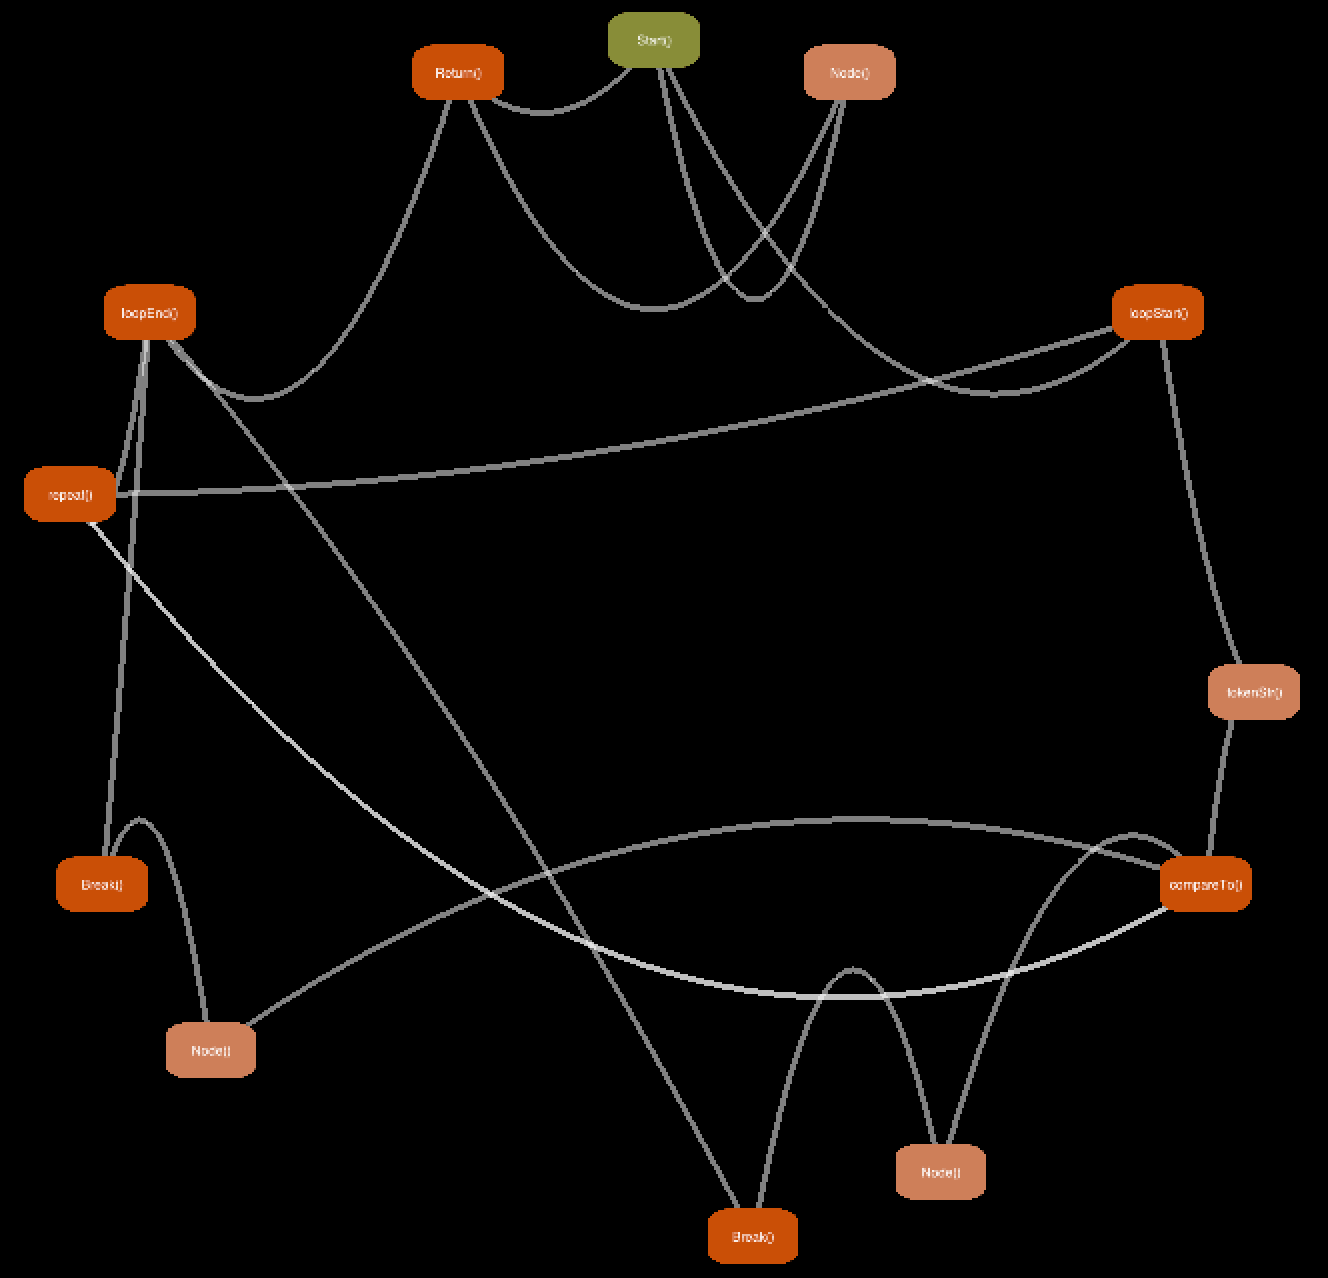
Lastly we take a look at these graphs with the nodes arranged in a circle.
Oooohhh, Aaahhhhh. Yes I know it's beautiful, that was the whole point of this project anyways. This layout makes it difficult to follow the flow of the program, but it does show connectivity well, and the places where code can jump way ahead in execution. Additionally this layout allows for many more nodes to be placed on the screen at a given time, thus making it useful for viewing large graphs.
An interesting note about the circular layout as well is that the curve system needed to be changed. The quadratic spline system described above breaks down in some of these cases as it does not guarantee that the placed control point becomes the inflection point of the parabola. Instead this layout makes use of Bezier curves which guarantee bending about the control point. Placement of control points is still done in the same way.