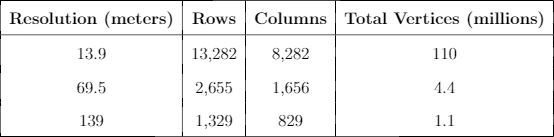
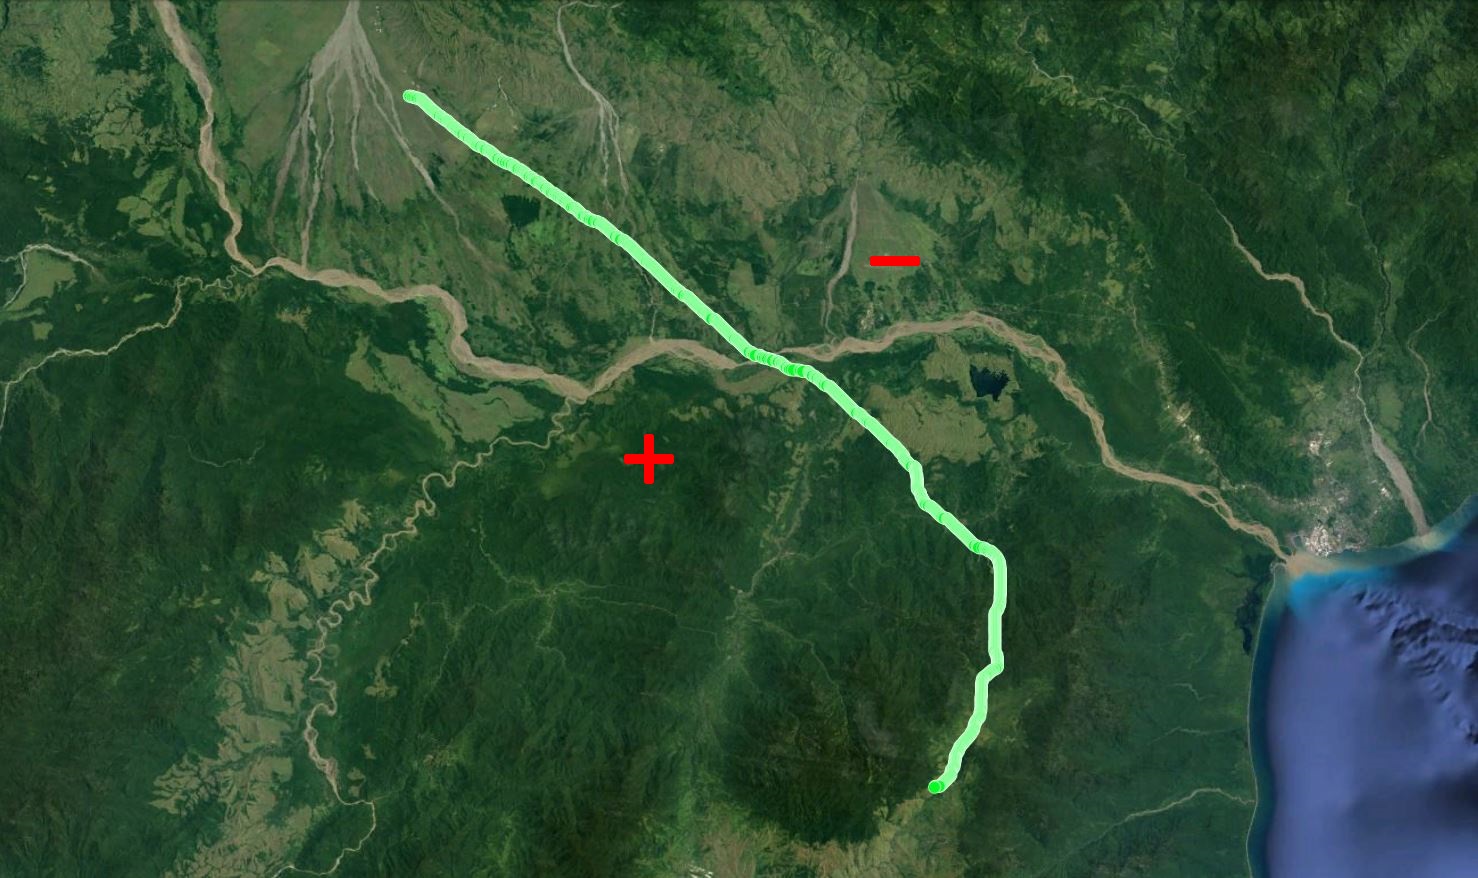
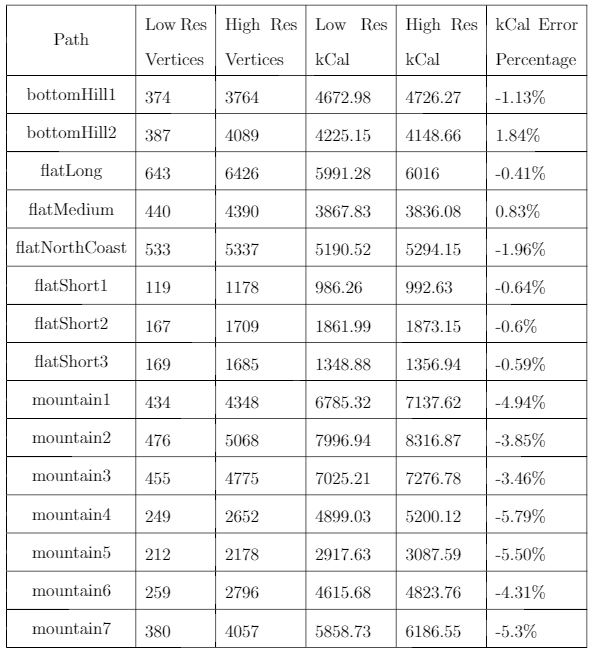
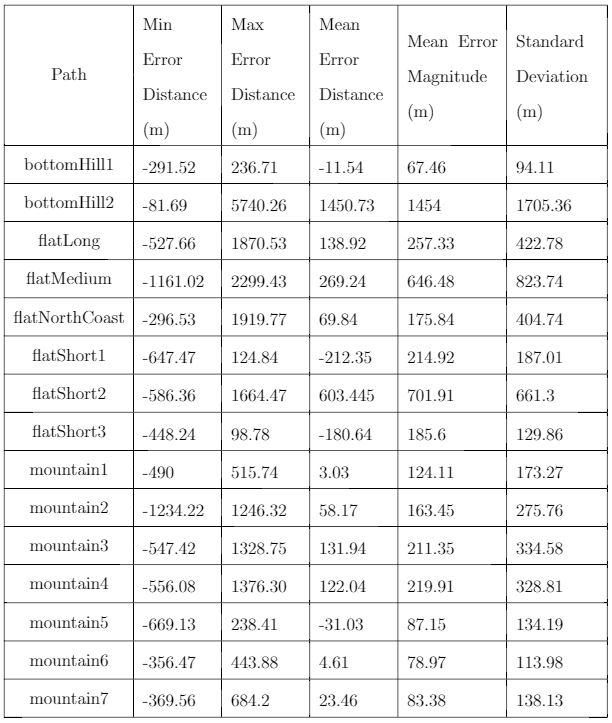
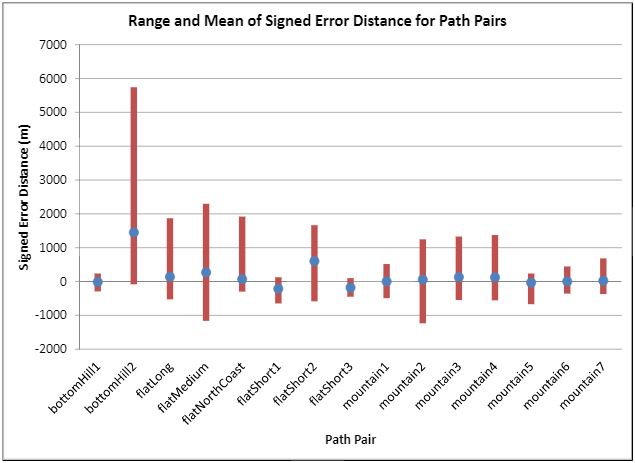
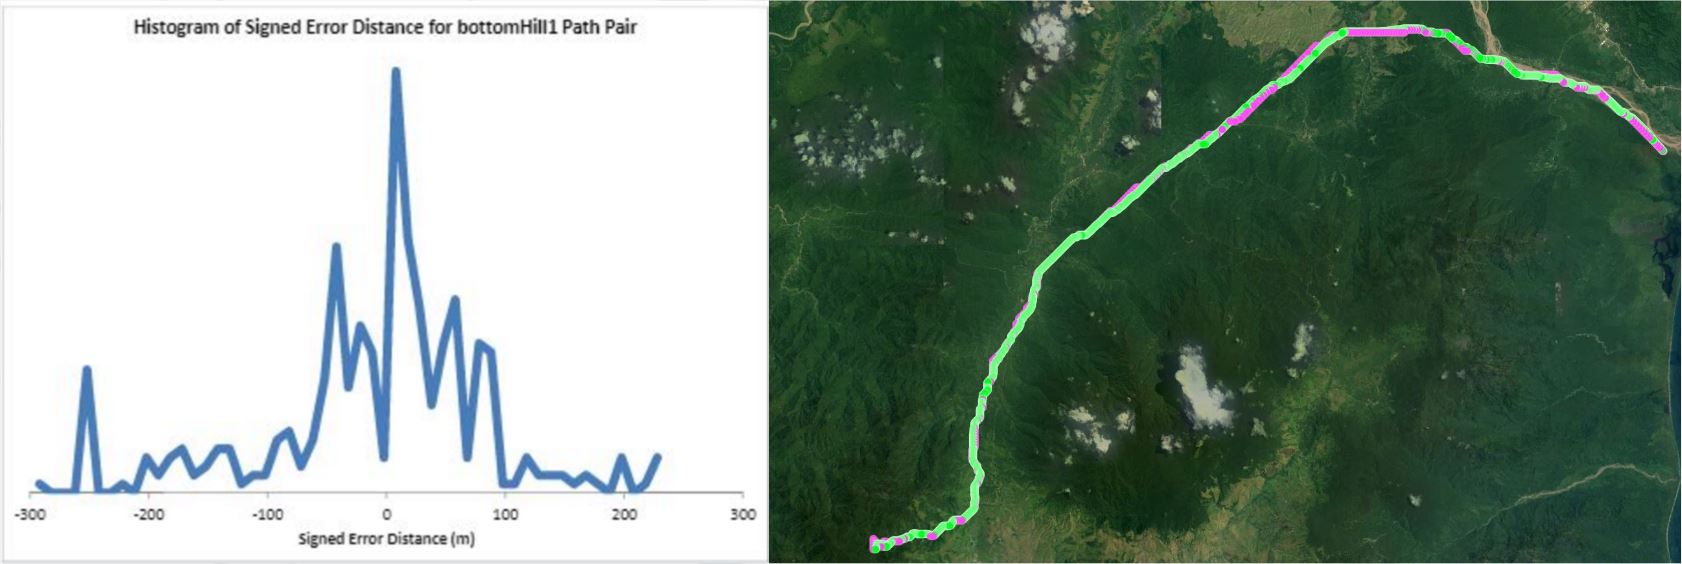
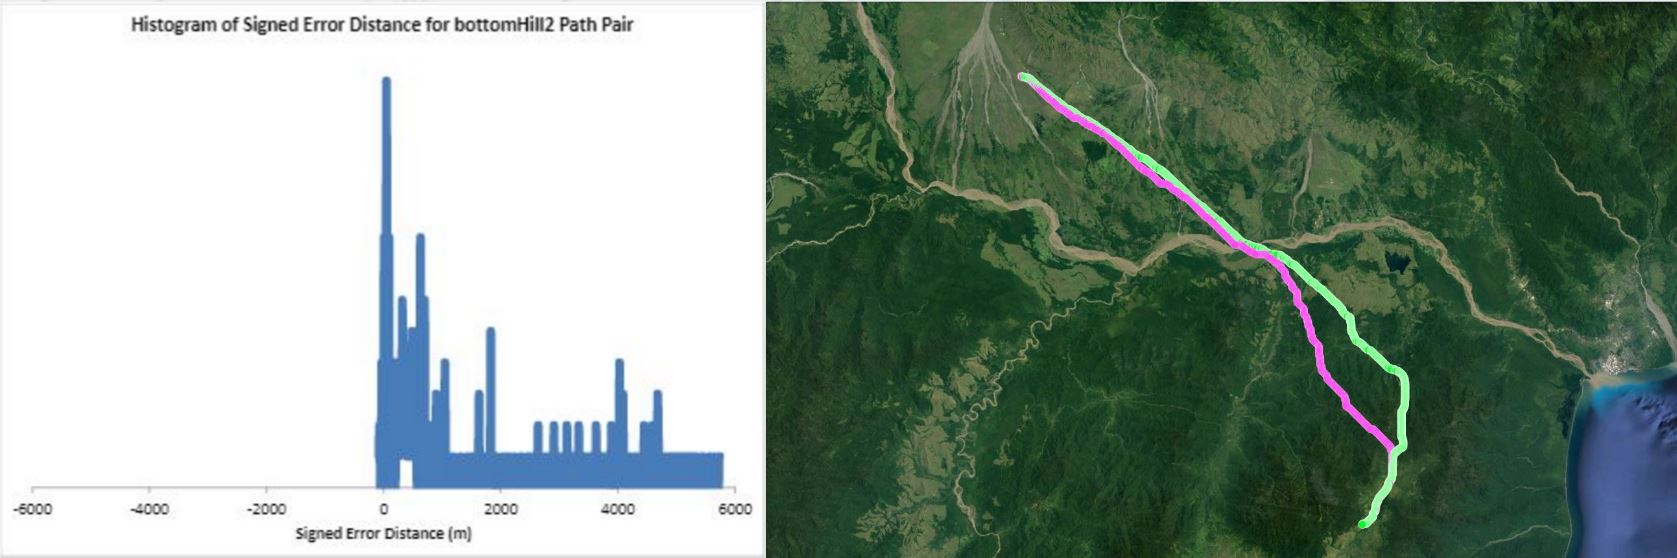
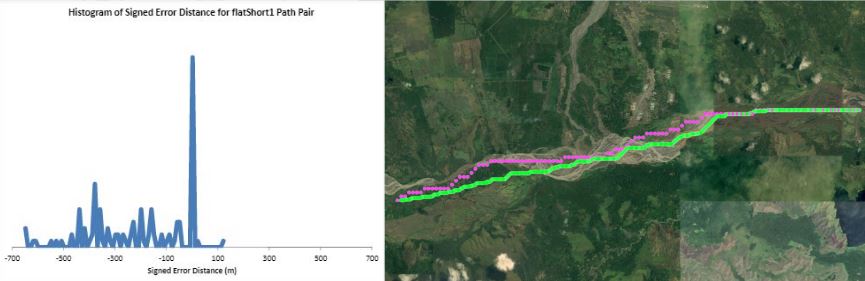
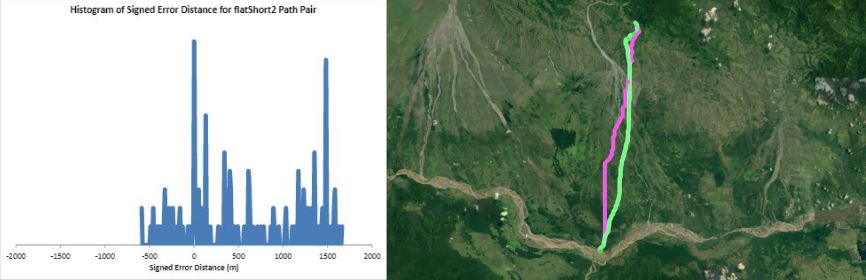
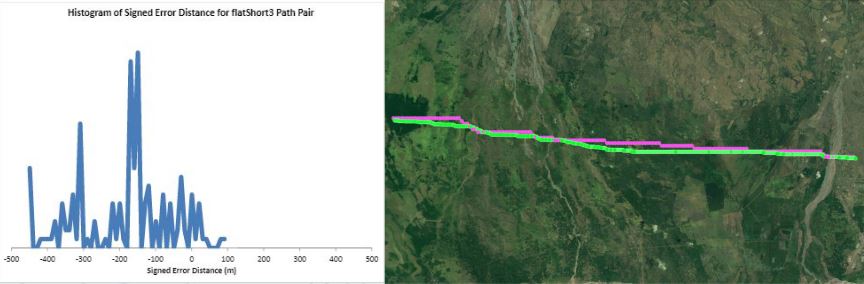
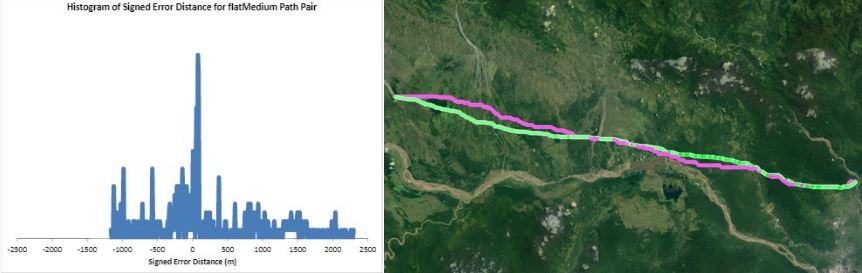
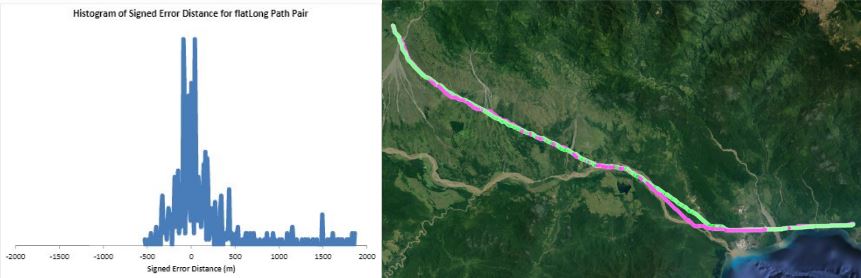
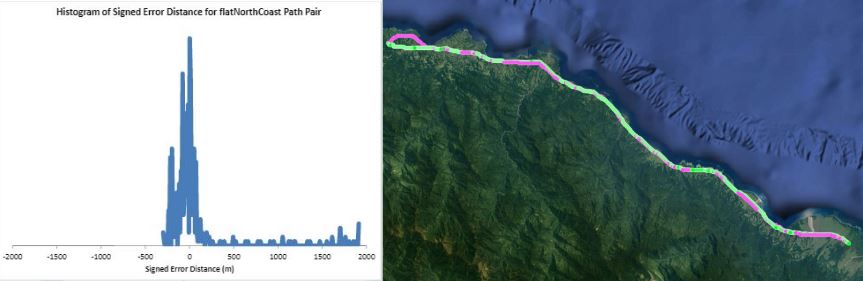
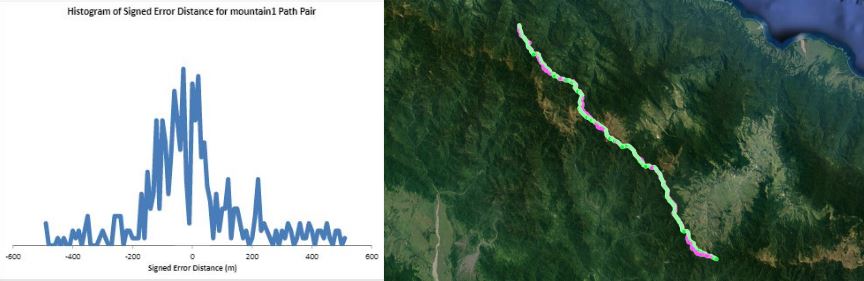
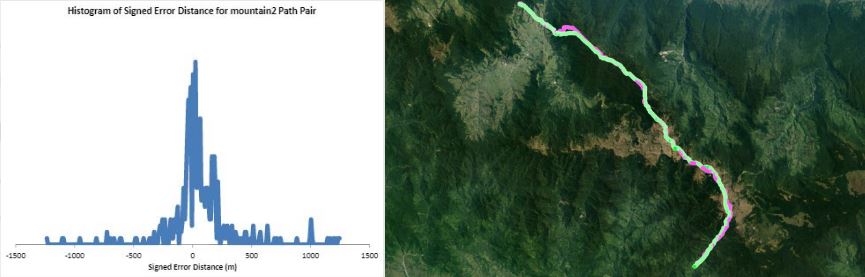
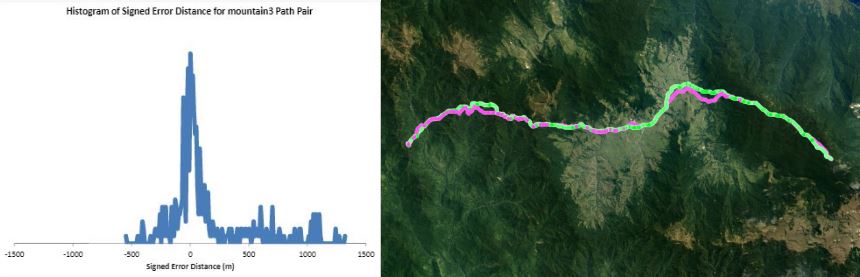
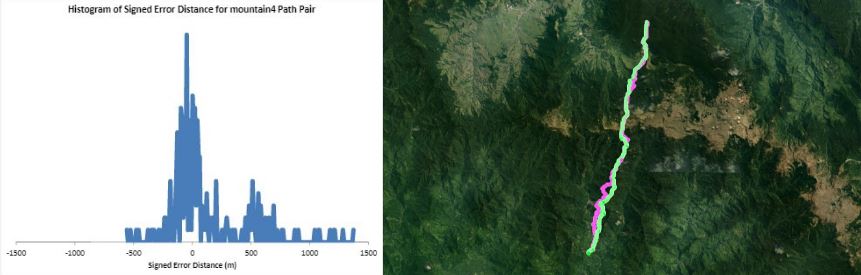
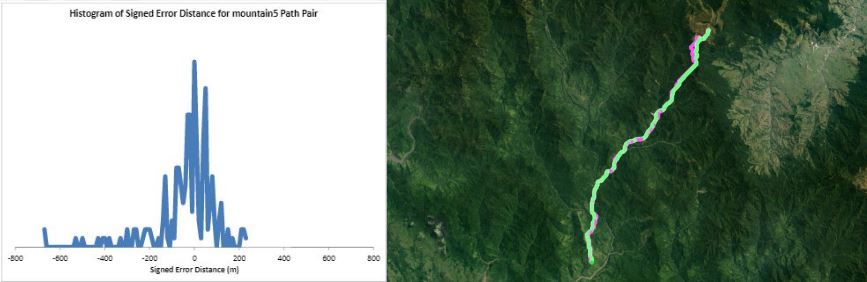
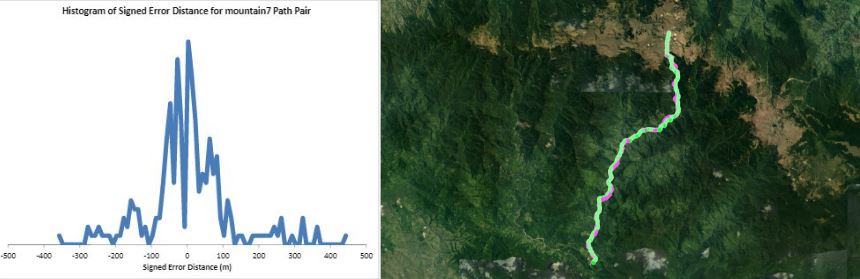
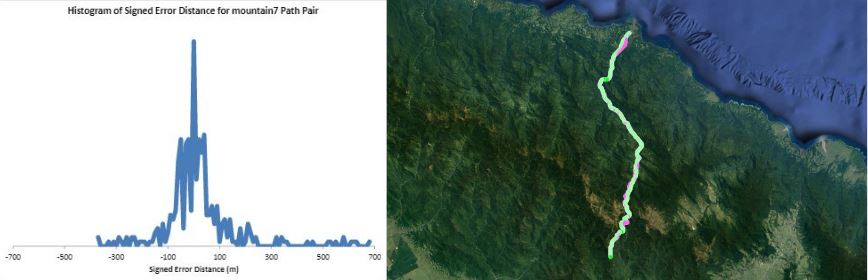
Humans traveling on foot tend to not travel as the crow flies in a constant direction, but rather they follow the least cost path. Cost is measured in this work as energy expenditure in kilocalories. Least cost caloric paths often avoid steep mountain ranges and large bodies of water, and tend to follow flat stretches of terrain. Dijkstra's algorithm is used to find the path across DEM terrain data with edge weights associated with the caloric cost of traveling. DEM data was generated from two satellite images, producing terrain data at 13.9 meter resolution containing 110 million vertices. Two additional DEM files were created from subsampling this file, one at 5 time resulting in a 69.5m resolution file and one at 10 times resulting in a 139m resolution file. This final project is an error analysis of the trade-offs of running paths on high resolution data files versus low resolution data files. In order to examine the differences in running the different resolutions of DEM terrain data files, 15 paths were computed at both low resolution (139m) and high resolution (13.9m). It is assumed that the path computed on the high resolution data file is more accurate than the path computed at the low resolution due to the higher sampling rate of the terrain data. For a given pair of paths, the start and end points are the same, and the labels of the path pairs (seen in this table) are somewhat descriptive of the terrain they traverse. For each vertex in the low resolution path, the closest point on the high resolution path is computed and the 2D Euclidean distance between them is measured. A signed distance is used, meaning that from a bird's-eye view, all low resolution points lying to the left of the high resolution path have a negative sign while all low resolution points lying to the right of the high resolution path have a positive sign. This sign assignment is arbitrary and is mainly used to examine a histogram of these error distances which is centered at zero, rather than one-sided. All of the 15 paths have kilocalorie expenditure differences in the two paths that do not exceed 6%. Slight increases in kilocalorie sums of high resolution paths are expected because the edge weight function is nonlinear with respect to elevation changes, so that the edge weight for an elevation gain of 10X is not equal to 10* the elevation gain of X We are doing these error calculations matching low resolution path points to high resolution paths, but we did also test the reverse of matching high resolution points to the low resolution path for one sample path pair [mountain1]. In this test, the means were 3m for low to high and 2.5m for high to low, so these results are similar. The min error distance is the distance of the low res point furthest away from the high res path, on the left. Similarly, the max error distance is the distance of the low res point furthest away from the high res path, on the right. Mean is the average of the signed error distance values, and mean error magnitude is the average of the magnitudes of the error distance. Over all 15 paths, the average error, normalized for path length, is 183.13m. However, if we take out the outlier bottomHill2, the normalized average error become 83.22m. This average error is 1.32 low resolution grid squares and over 13 high resolution grid squares. Given that high resolution DEM file paths have computation times of hours while low resolution DEM file paths have minutes- or even seconds-long computation times, this average error could be worthwhile in order to have rapid path computations with increased user interaction. This could be perhaps in non-critical analyses, path estimates, or in planning the possible paths to subsequently run at high resolution.