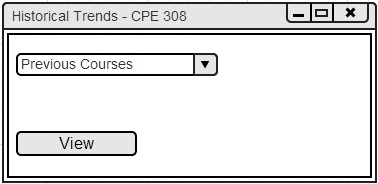
The historical trends tool provides users with access to previous quarter's course data including the histogram, pie chart, and statistics. The initial historical trends screen can be shown in Figure 2.6.4.1.
Figure 2.6.4.1: Historical Trends Initial Window.
The user can see a drop-down box on the main screen. The drop-down box contains the list of previous quarters that the current course was offered. The selection menu shown in Figure 2.6.4.2 appears when the user clicks the drop-down box.
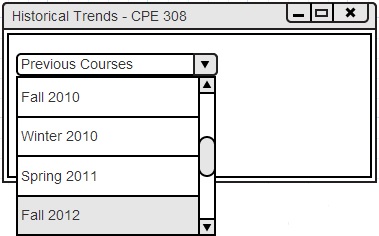
Figure 2.6.4.2: Historical Trends Selection Menu.
The user can select their desired quarter from the drop-down selection menu in Figure 2.6.4.2.
Figure 2.6.4.3 contains the window view after the user has selected an option from the selection menu.
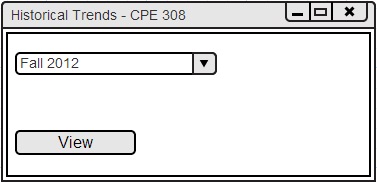
Figure 2.6.4.3: Historical Trends After Selection.
The user can click on the View button once their desired selection has been made. The View button opens up the trends for the course in the selected quarter. The trends include a histogram, pie chart, and statistics summary. Figure 2.6.4.4 shows the selected quarter's trends window.
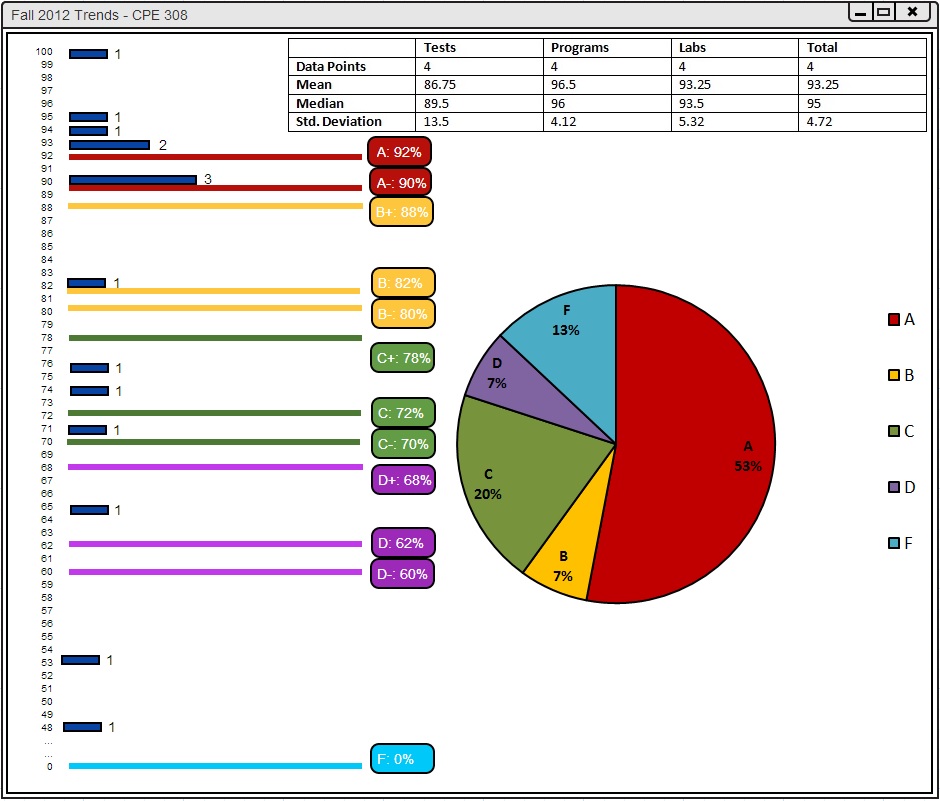
Figure 2.6.4.4: Historical Trends.