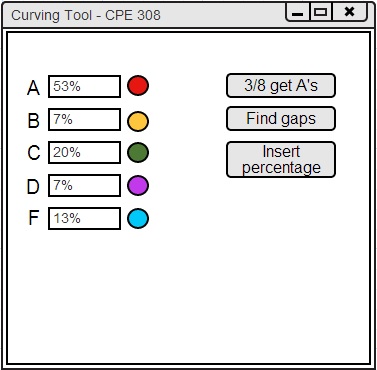
There are also various tools available for curving grades. You can curve grades by 3/8 of the class getting A's, inserting the percentage of students to award each grade to, or finding gaps within the grades to insert the letter grade cutoff bars. This is shown in Figure 2.6.3.1.
Figure 2.6.3.1: Curving Tools.
The left portion of the curving tool window contains the percentage of students currently receiving each letter grade as well as the color that represents each letter grade.
The percentage of students currently receiving each letter grade is a representation of the current curve. The user should apply one of the curving mechanisms to modify these percentages.
The user can modify the color representing a particular letter grade by clicking on the colored circular icon next to the letter grade.
A window will appear to allow the user to modify the color after the icon is clicked.
This color will represent the letter grade in the histogram, pie chart, curve tool, and spreadsheet.
This window is shown in Figure 2.6.3.2.
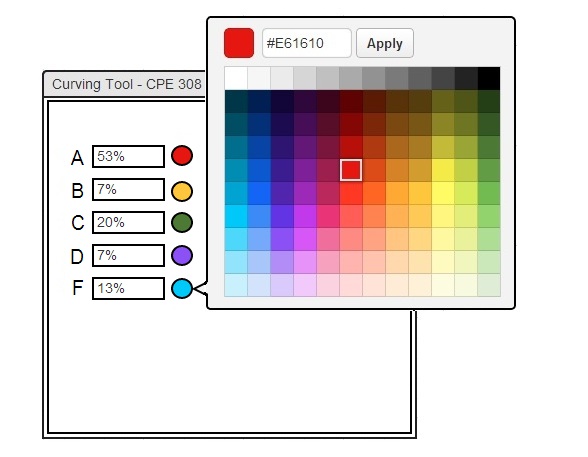
Figure 2.6.3.2: Modify Grade Color.
The colors of the histogram grade boundary bars, pie chart slices, spreadsheet, and grade selecting mechanisms will be syncronized with the color change of each letter grade. All these components' colors will be modified whenever the user modifies the colors that represent each letter grade.
There are three buttons in Figure 2.6.3.1. These buttons allow the user to curve the class in different ways.
The 3/8ths Get A's button sets the percentage of A's to
be 3/8 and modifies the rest of the grades accordingly. A more detailed description of this curving mechanism can be found on the 2.6.3.1. 3/8ths Get A's Curve page.
The Find Gaps button finds any major gaps between the percentage grades and puts the grade cutoffs in gaps. A more detailed description of this curving mechanism can be found on the 2.6.3.2. Find Gaps Curve page.
The Insert Percentage button clears all the
current percentages and then the user can input the desired percentage of students for each letter grade. A more detailed description of this curving mechanism can be found on the 2.6.3.3. Insert Percentage Curve page.
After each curving tool is executed, the percentage row will reflect the changes and so will the spreadsheet, histogram, and
pie chart.
The curve tool will have +/check/- options in the future.