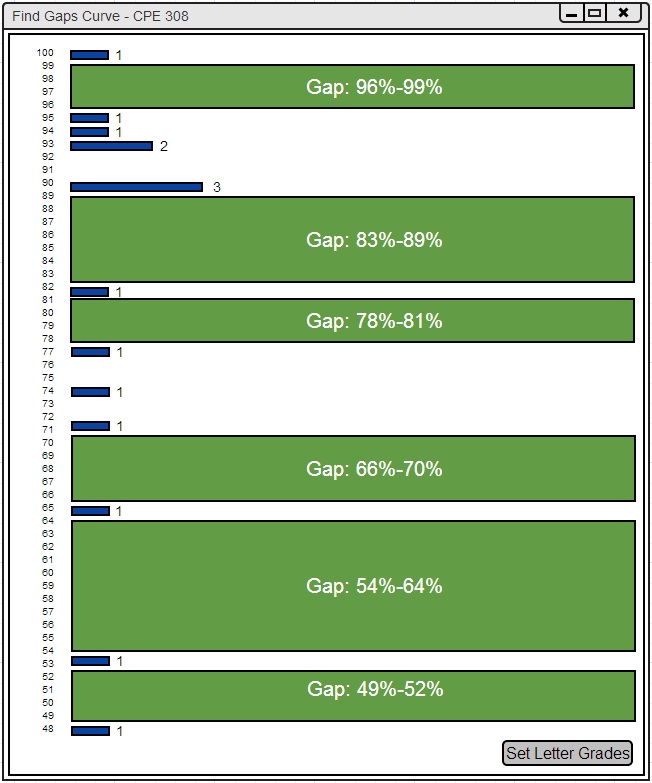
The main purpose of the find gaps curving mechanism is to separate letter grades based on significant percentage grade differences in the course. This way students with almost identical percentage grades don't receive different letter grades.
Figure 2.6.3.2.1: Curving: Find Gaps.
The histogram in Figure 2.6.3.2.1 appears after the Find Gaps button is pressed in the curving tool window. This histogram contains green sections which represent significant gaps in percentage grades. A significant gap is any gap in students' grades that is 3% or greater. The green sections contain text within them stating the gap's range. If these gaps look like good places to put letter grade boundaries, the user can press the Set Letter Grades button in the bottom right corner of the window. Pressing this button will open the window in Figure 2.6.3.2.2.
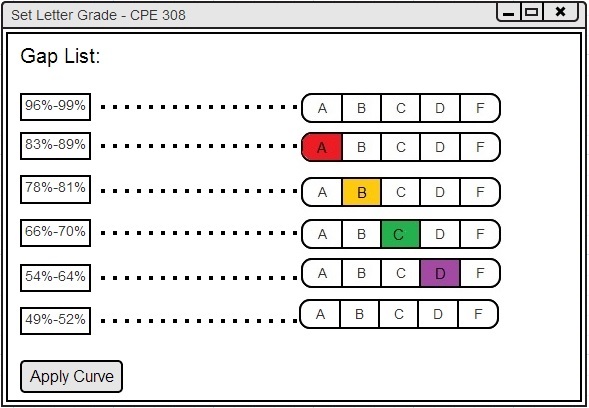
Figure 2.6.3.2.2: Set Curve: Find Gaps.
The window in Figure 2.6.3.2.2 appears after the Set Letter Grades button is pressed in the Find Gaps Curving Window (Figure 2.6.3.2.1). This window conatains a list of the gaps found, letter grade selection bars, and an Apply Curve button.
The list of gaps found are arranged by percentage range from highest to lowest.
Each percentage range gap is connected to a letter grade selection bar.
This selection bar allows the user to select a letter grade boundary for the given gap.
The user does not have to select a letter grade for every possible gap.
For example, the user can leave the letter grade boundary selection blank for a given gap.
The user also doesn't have to select a gap for every letter grade.
For example, the user can select a gap for the A and C letter grade boundaries but not B, D, and F.
If the user decides not to select a gap for all letter grades, the current letter grade boundaries for the unselected letter grades remain the same.
The user should press the Apply Curve button once all desired letter grade boundaries have been paired with a gap. This will edit the histogram, pie chart, and spreadsheet.
The user must use the insert percentage curve or manually set the letter grade boundaries in the histogram or pie chart if the user wants to modify the other letter grade boundaries after applying the find gaps curve.
The resultant histogram, pie chart, and spreadsheet from the find gaps curve are shown in Figure 2.6.3.2.3.
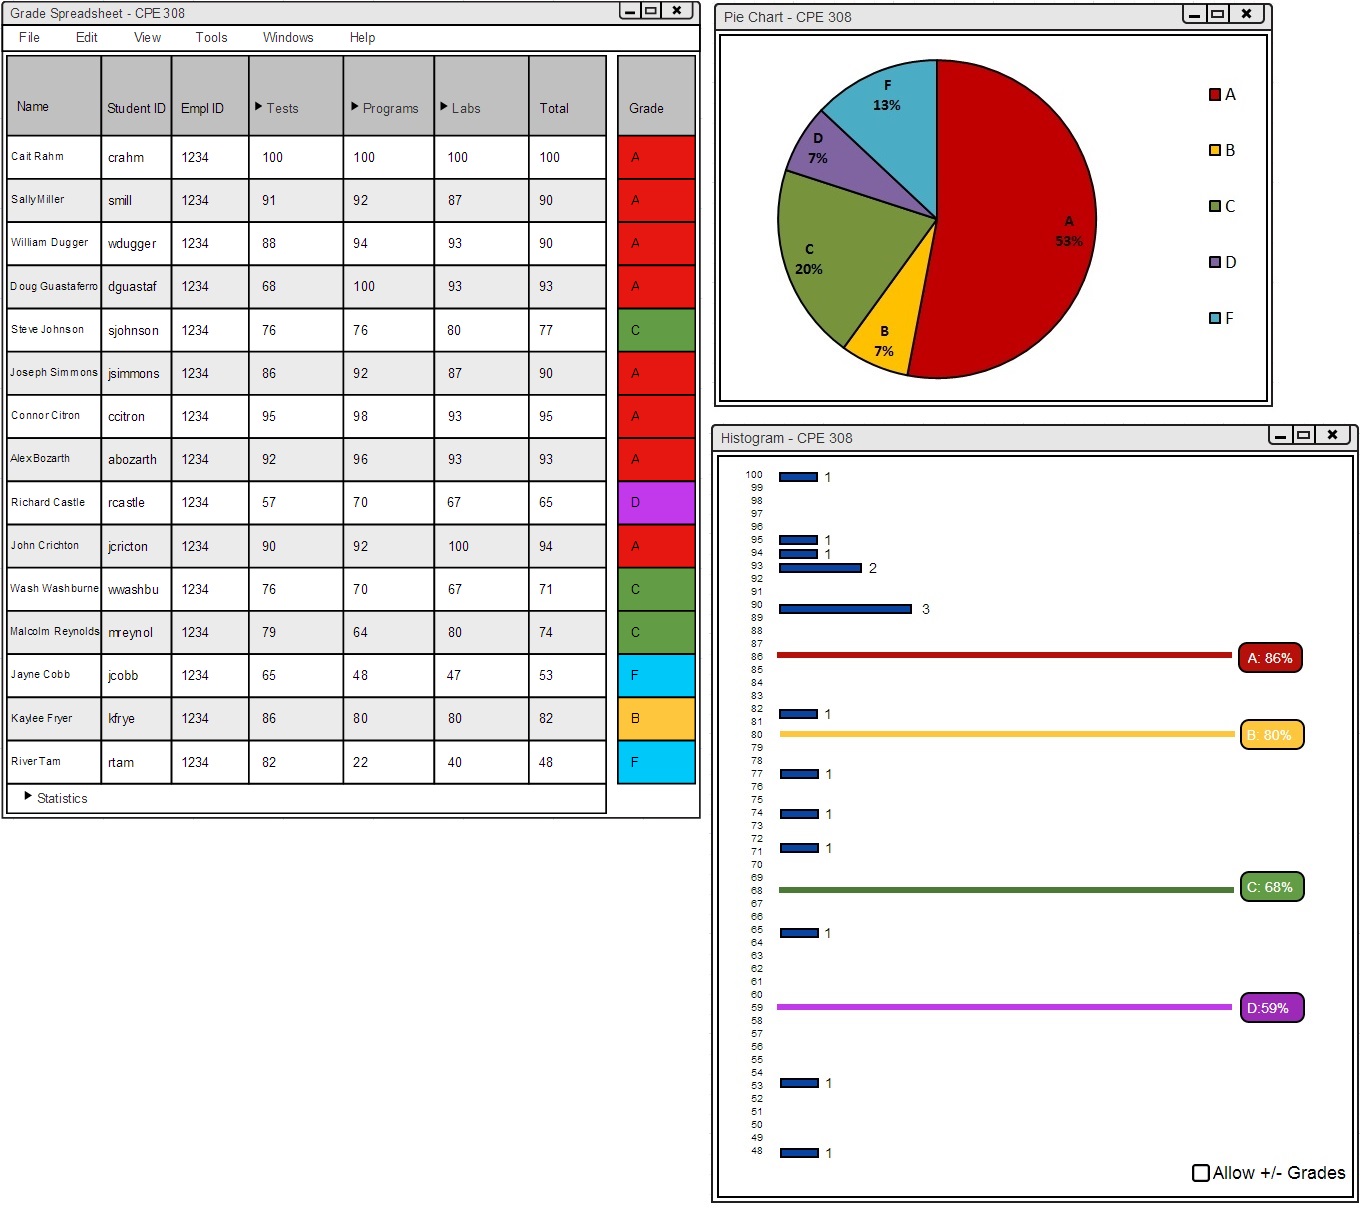
Figure 2.6.3.2.3: Apply Curve: Find Gaps.