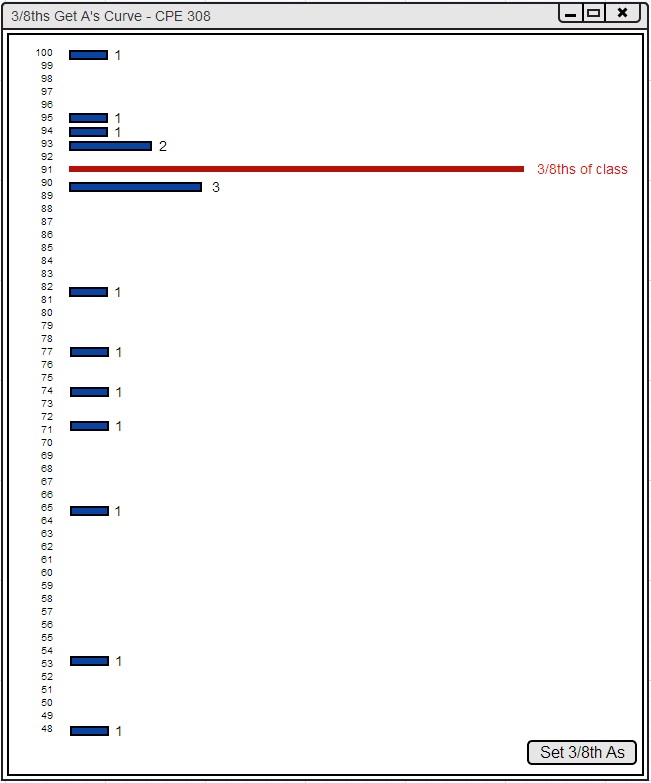
The main point of this curve is to allow 3/8ths of the students to earn an A letter grade. This curve calculates the amount of students that make up 3/8ths of the class, then determines the top 3/8ths of the class using that number.
Figure 2.6.3.1.1: Curving: 3/8th Get A's.
The histogram in Figure 2.6.3.1.1 appears after the 3/8 Get A's button is pressed in the curving tool window. This histogram contains a red bar that indicates where the boundary of the top 3/8 of the class lies. This red bar would indicate the "A" letter grade boundary if this curve is applied. The user can select the Set 3/8th A's button at the bottom of the window if this A-boundary is desired. Pressing the Set 3/8th A's button brings up the window that appears in Figure 2.6.3.1.2.
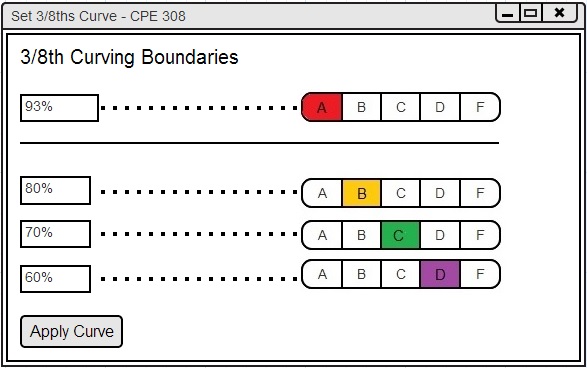
Figure 2.6.3.1.2: Set Curve: 3/8th Get A's.
The window in Figure 2.6.3.1.2 allows the user to personalize the given curve and then apply the curve. The window lists the new boundary for 3/8 of the students getting A's and the current letter grade boundaries of the other letter grades. The user can manually modify the other letter grade boundaries by inserting a new percentage for the lower bound. The user may also choose to not modify the other letter grade boundaries. The other letter grade boundaries will remain the same as before if the user does not modify the boundaries. The user must click Apply Curve to set the 3/8ths Get A's curve. The histogram, pie chart, and spreadsheet will be modfied when the curve is applied (shown in Figure 2.6.3.1.3).
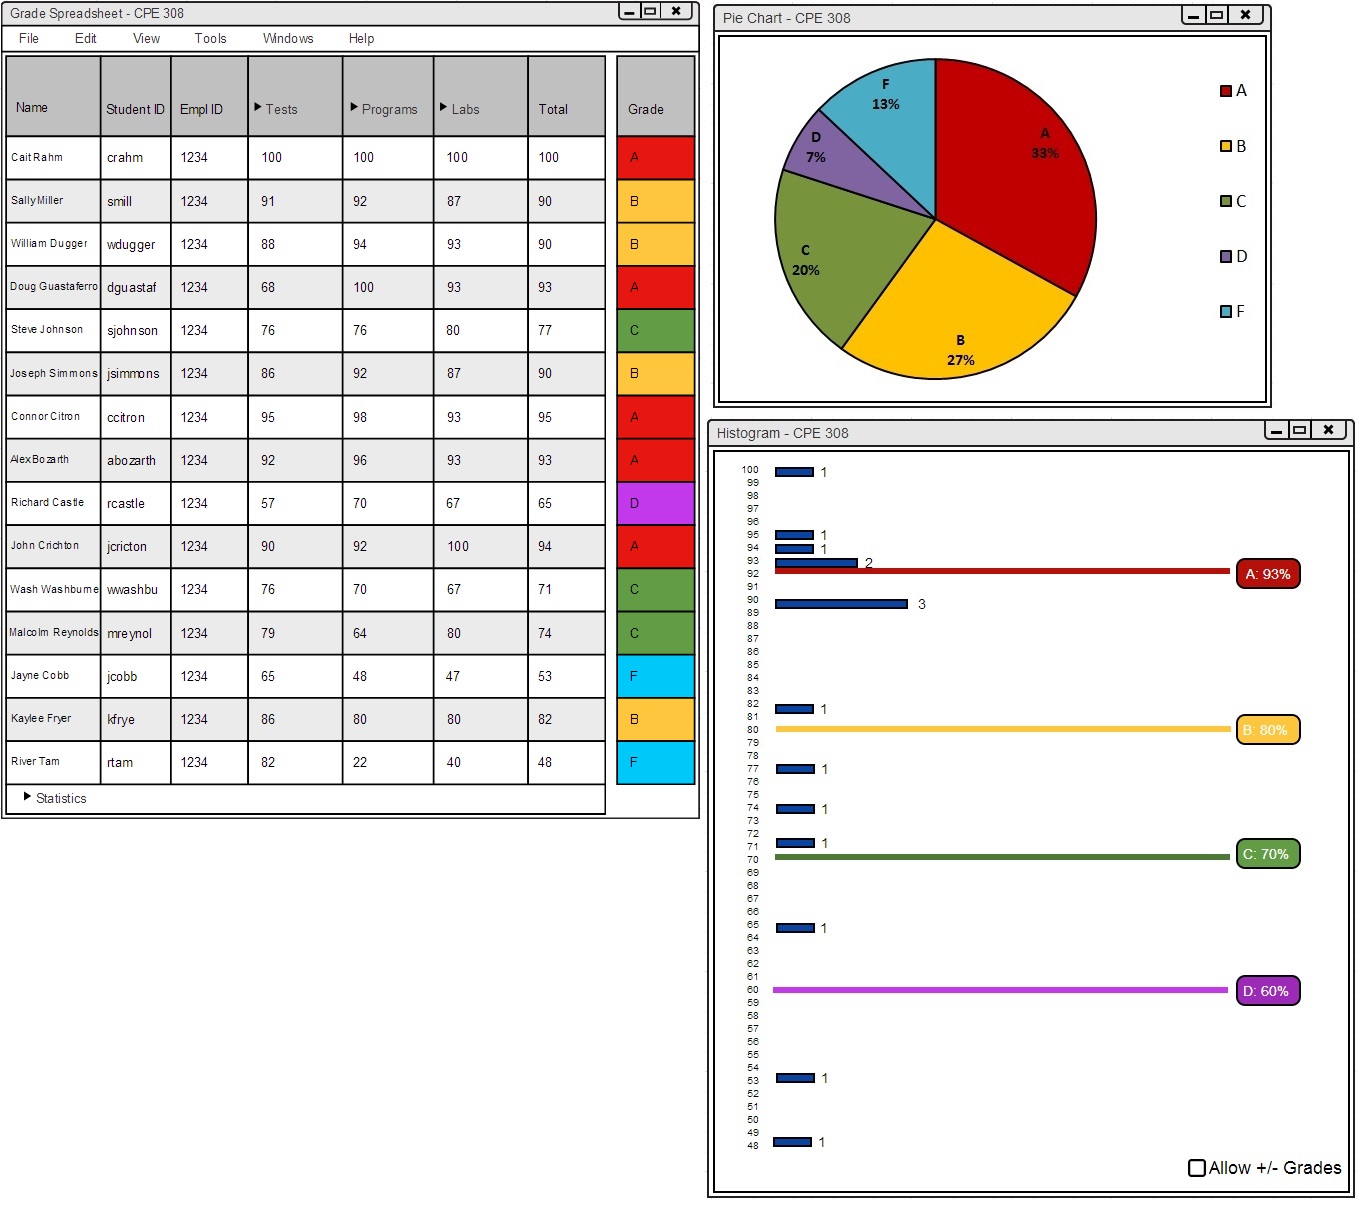
Figure 2.6.3.1.3: Apply Curve: 3/8th Get A's.