When the user initially opens the histogram to view grades, the user will see the display in Figure 2.6.1.1 or Figure 2.6.1.11. If the user is an instructor, the user will see the display in Figure 2.6.1.1. If the user is a student, the user will see the display in Figure 2.6.1.11.
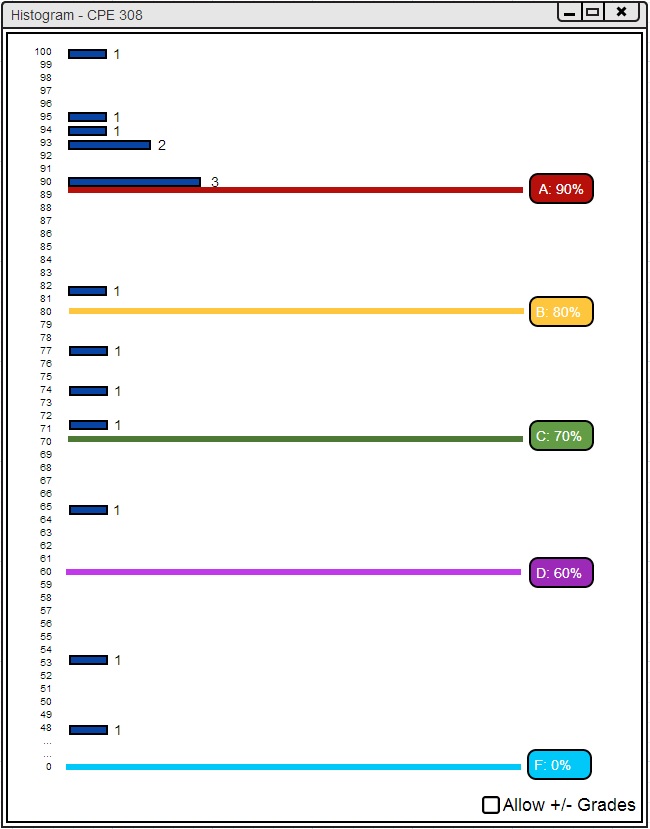
Figure 2.6.1.1: Histogram--Instructor View
The initial instructor display consists of one window: a histogram of the tabulated student
course grade data. The histogram is syncronized with the current student grades (the spreadsheet),
the pie chart, and the curving tool.
There are also labels on the histogram for how many students are receiving each
grade, how many students have a particular percentage grade, and what percentage range the
letter grade carries.
There are agile bars that indicate the letter grade cutoffs. The user
can move these bars to change the letter grade cutoffs. The user can even decide
to omit a certain grade bar (not have any students receive a particular grade) by
dragging the bar directly underneath the higher letter grade bar.
The original pie chart and spreadsheet are shown in Figure 2.6.1.2 before any bars are moved.
They are currently syncronized with the histogram in Figure 2.6.1.1.
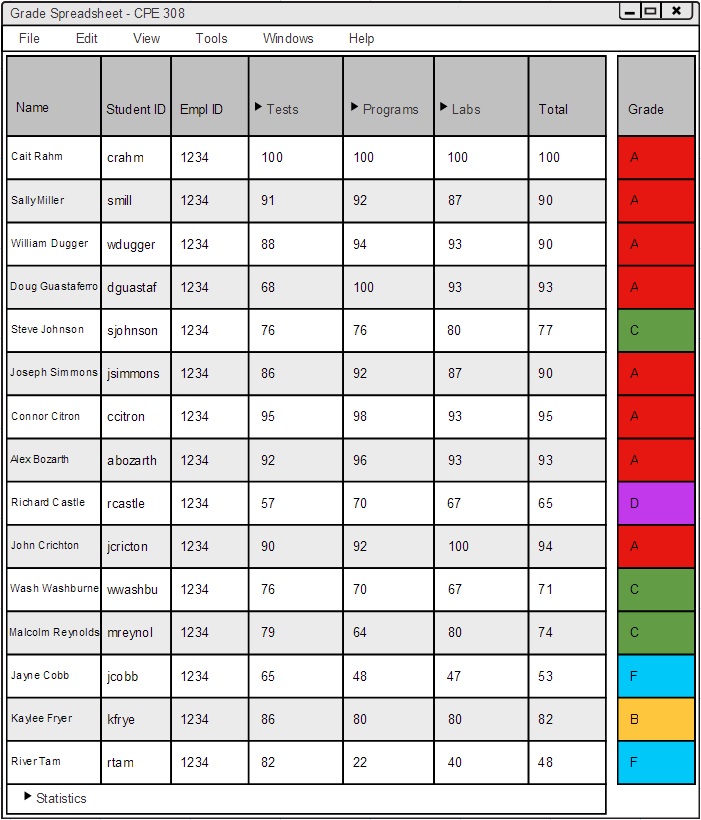
Figure 2.6.1.2: Pie Chart and Spreadsheet--Original View
An example of moving the agile bars is shown in Figure 2.6.1.3 where D's and F's are omitted.
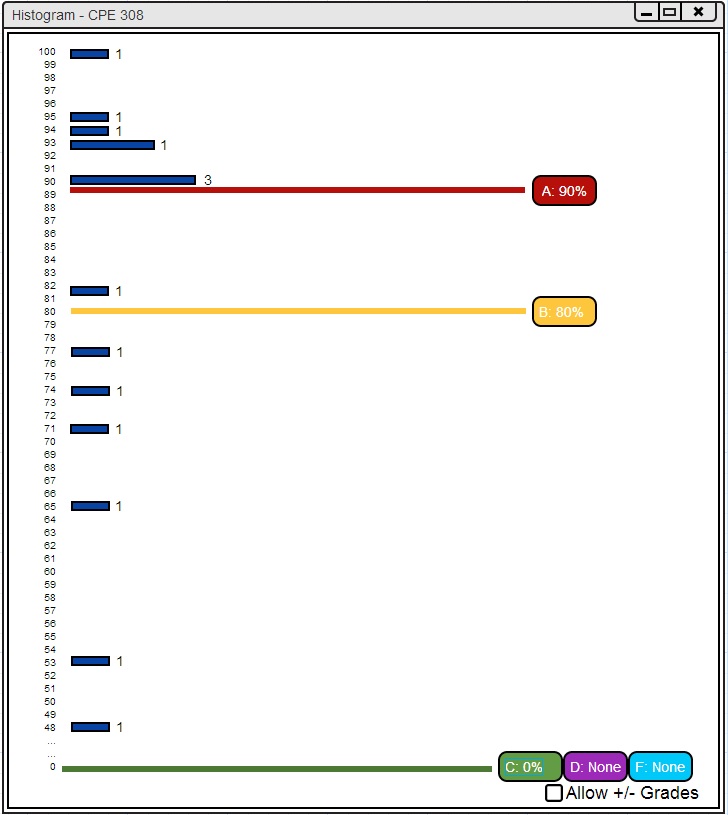
Figure 2.6.1.3: Histogram--D's and F's Omitted
The result of D's and F's being omitted (Figure 2.6.1.3) is caused by dragging the C boundary down to 0%.
The D and F boundaries connect with C when the C boundary is dragged to 0%.
The spreadsheet and pie chart that result from this curve is shown in Figure 2.6.1.4.
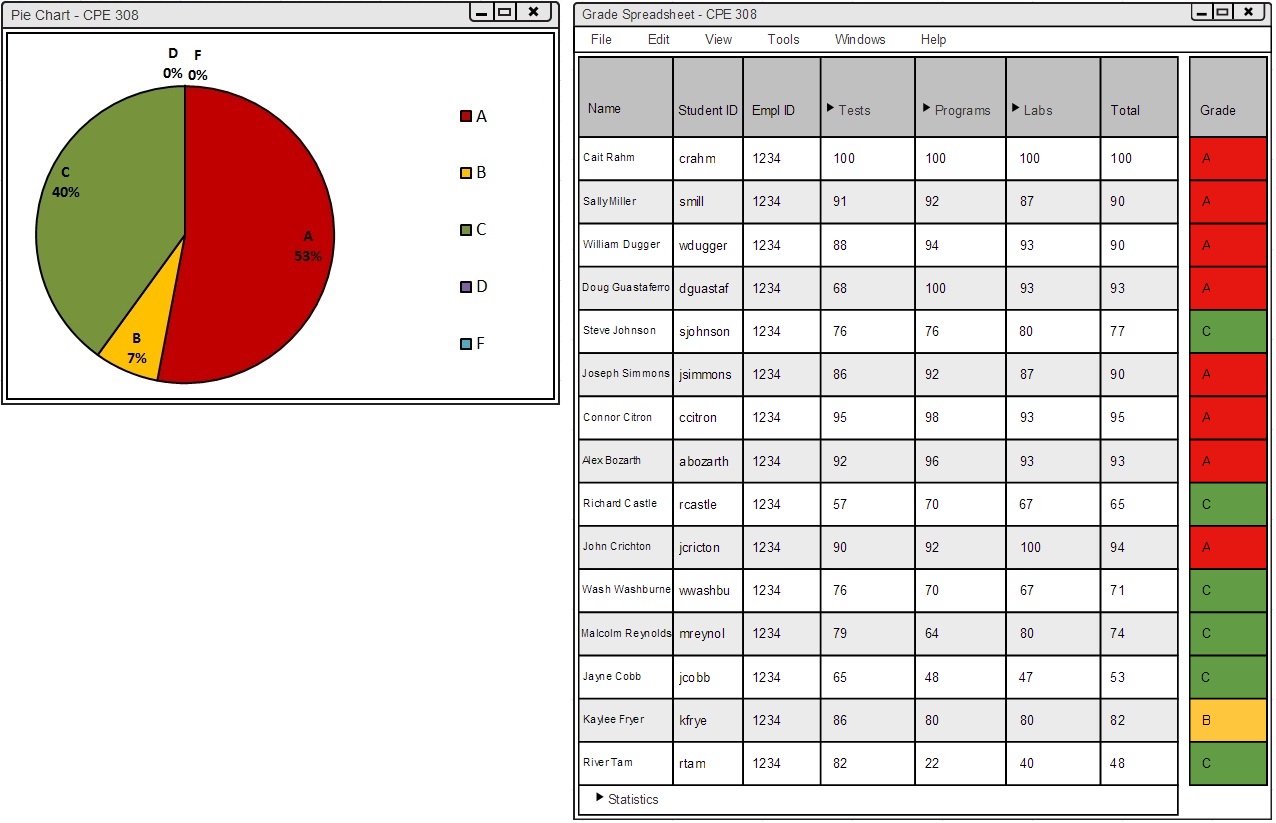
Figure 2.6.1.4: Pie Chart and Spreadsheet--D's and F's Omitted
The user can also assign the class a single letter grade shown in Figure 2.6.1.5.
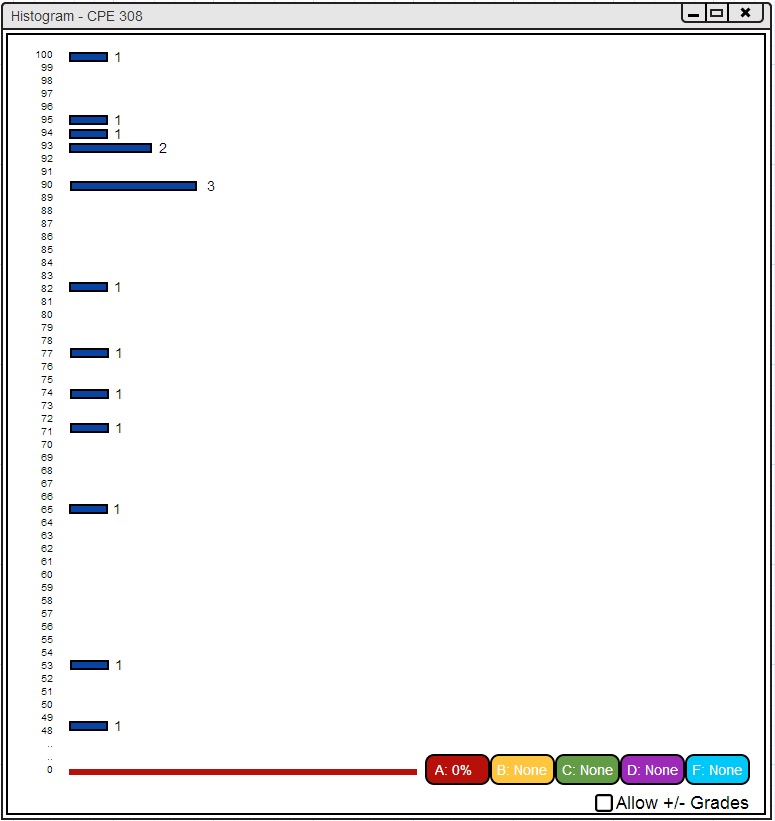
Figure 2.6.1.5: Histogram--All A's
The result of B's, C's, D's, and F's being omitted (Figure 2.6.1.5) is caused by dragging the A boundary down to 0%.
The B, C, D, and F boundaries connect with A when the A boundary is dragged to 0%.
The spreadsheet and pie chart that result from this curve is shown in Figure 2.6.1.6.
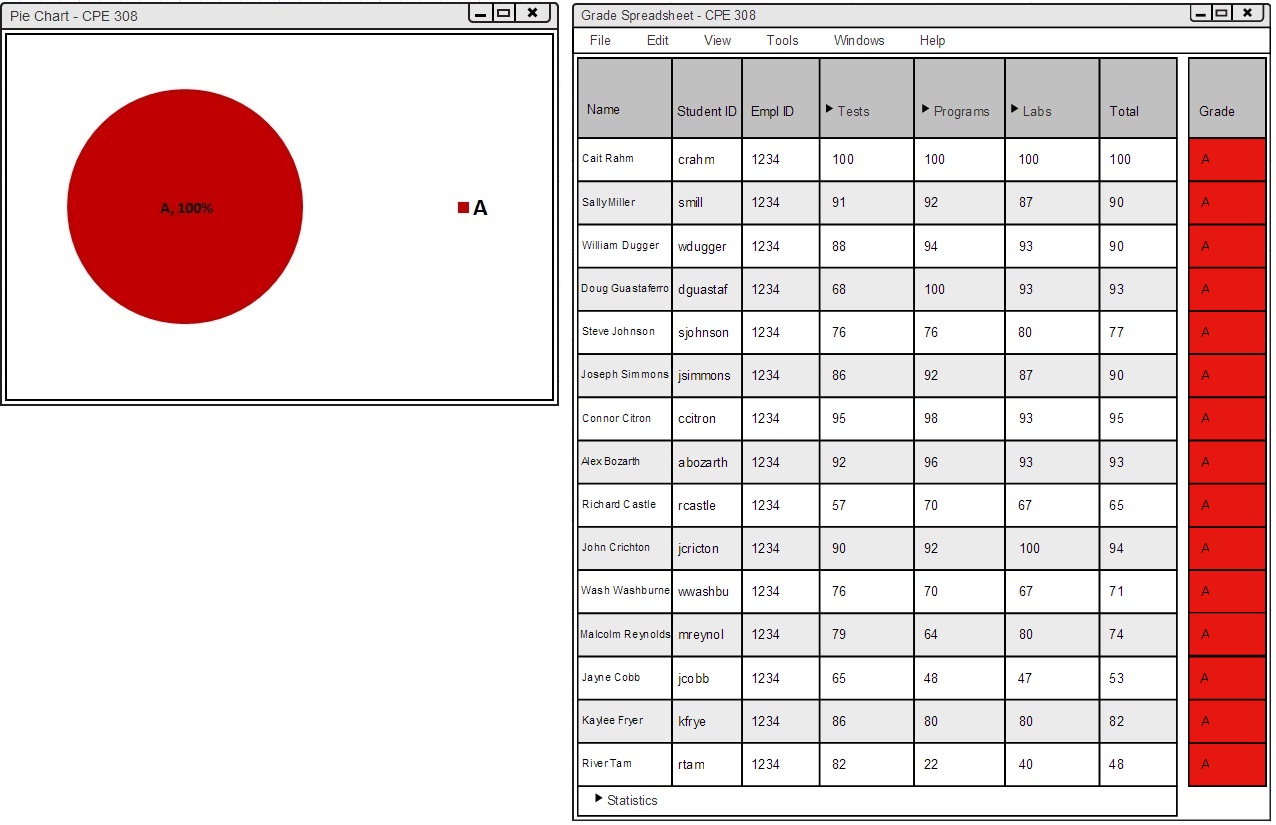
Figure 2.6.1.6: Pie Chart and Spreadsheet--All A's
The user can easily change the whole class to receive B letter grades by clicking on the B: None button. This will automatically change the B boundary to 0% and the A boundary to None. An example of this is shown in Figure 2.6.1.7.
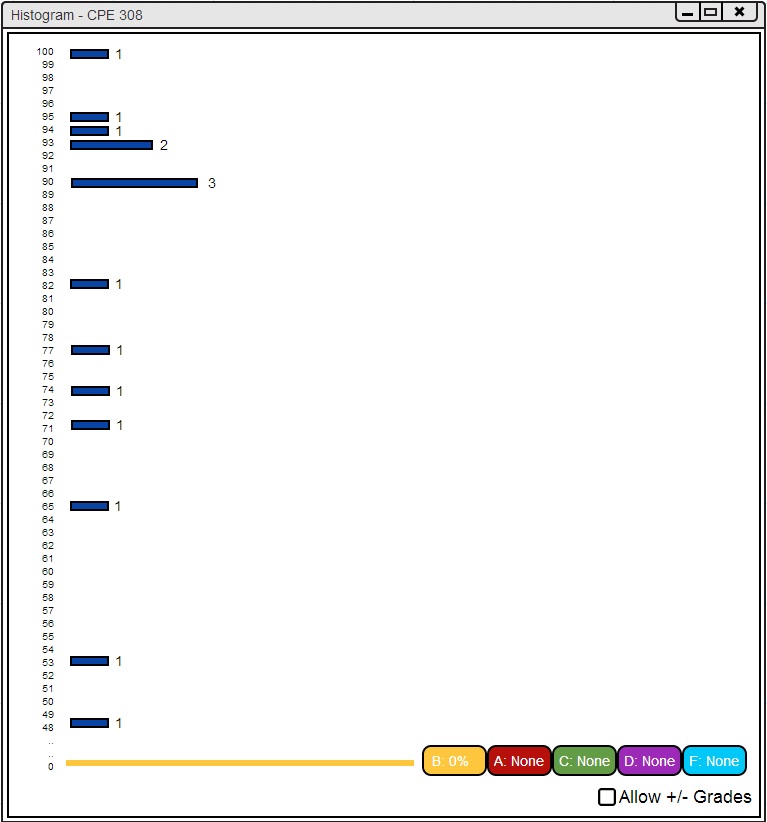
Figure 2.6.1.7: Histogram--All B's
The user can split the letter grade boundary bars apart by clicking on one of the letter grade buttons and dragging it to the desired destination. An example of dragging A to 85% is shown in Figure 2.6.1.8.
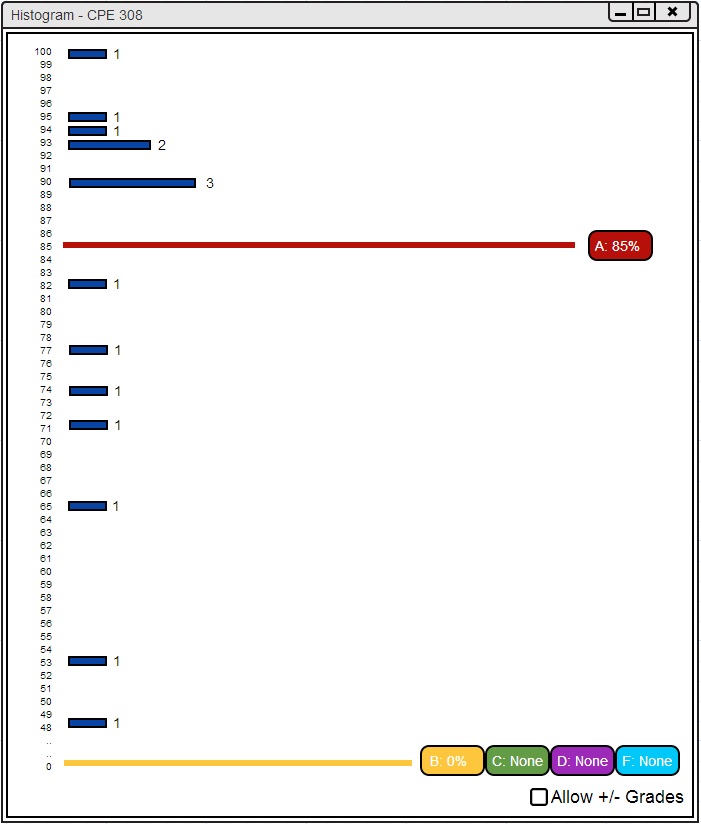
Figure 2.6.1.8: Histogram--Drag A Result
Now C, D, and F are still combined with B but A has its own boundary bar. The result of this transition on the spreadsheet and pie chart is shown in Figure 2.6.1.9.
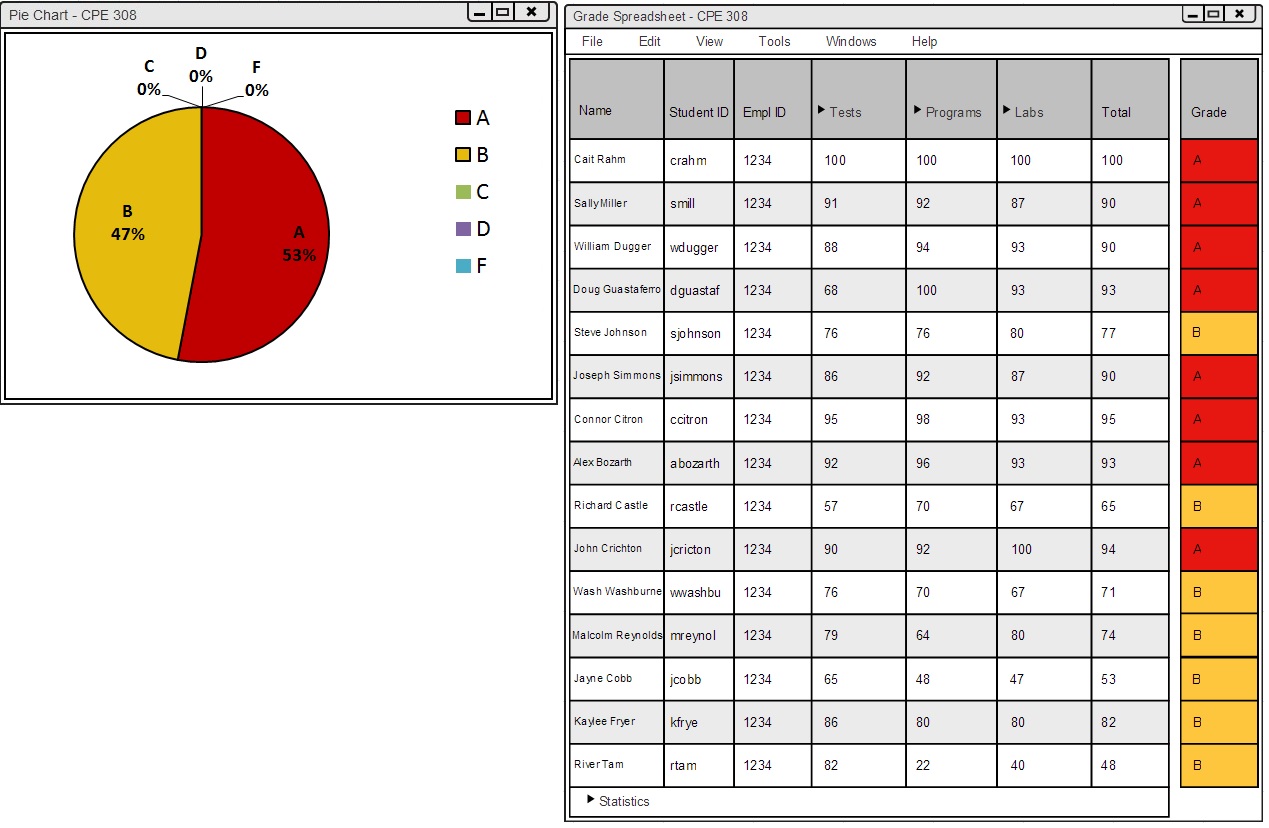
Figure 2.6.1.9: Pie Chart and Spreadsheet--Only A's and B's Result
There is a Allow +/- Grades check-box on the bottom of the histogram. No +/- letter grade boundary bars will show if the box is unchecked. An example of no +/- letter grades is in Figure 2.6.1.1. The user may choose to view +/- letter grades by checking the box. There is a histogram example that includes +/- letter grades in Figure 2.6.1.10.
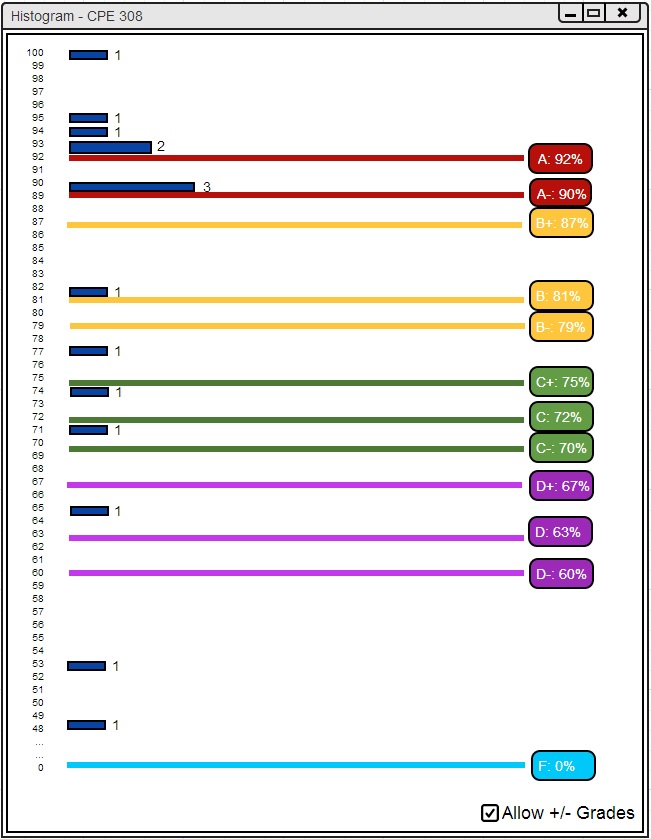
Figure 2.6.1.10: Histogram--Instructor View +/- Included
The user will be able to move the +/- letter grade boundary bars in the same way as the normal letter grade bars.
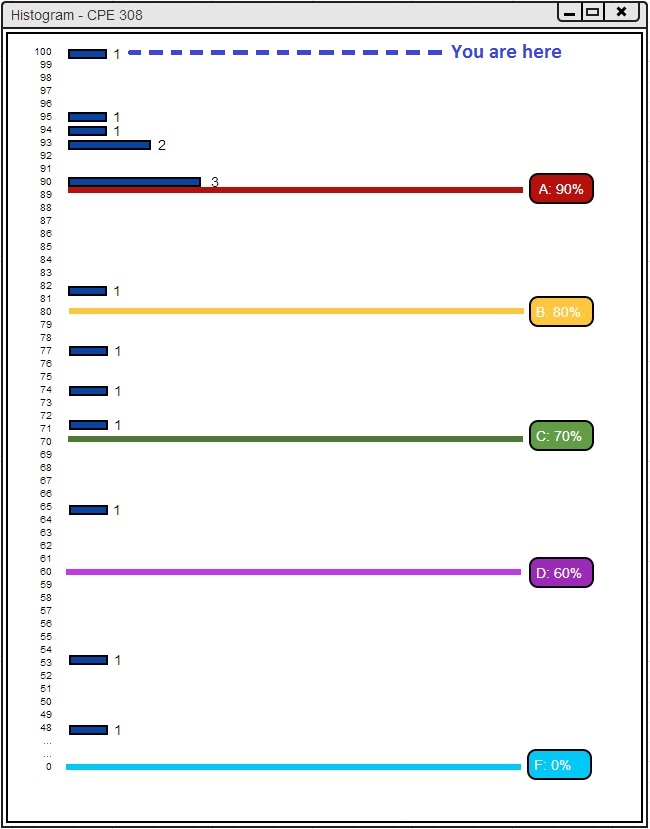
Figure 2.6.1.11: Histogram--Student View
The student view of the histogram differs slightly from the instructor's view. This view is shown in Figure 2.6.1.11.
There is a dashed line that indicates the user's current rank in the class. The dashed line has a label titled You are here. This feature allows students to see where they are ranked in the class compared to everyone else.
Students also cannot move the letter grade cutoff bars. Thus, students cannot adjust the curve.
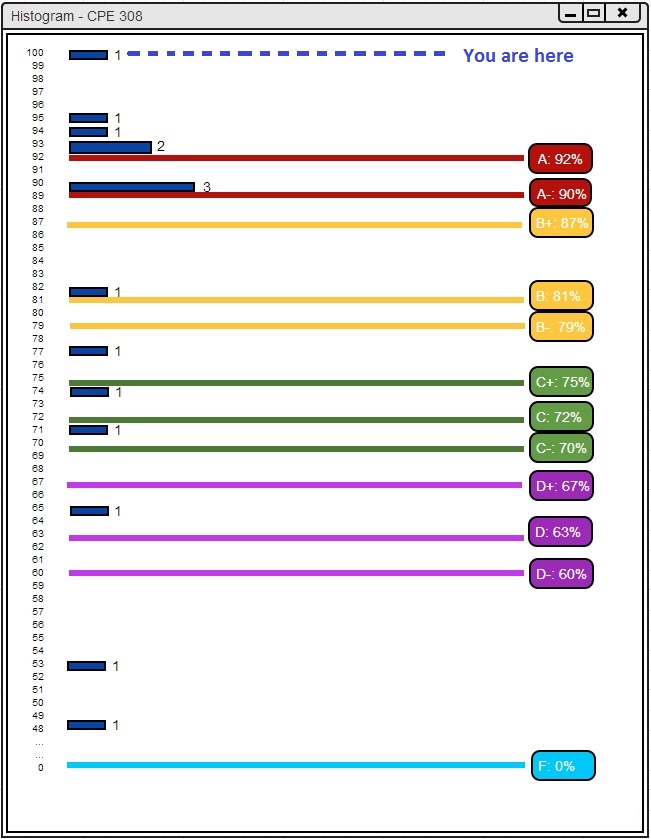
Figure 2.6.1.12: Histogram--Student View +/- Included
The student view of the histogram looks like the window in Figure 2.6.1.12 when the instructor allows +/- letter grades. This view will only be present if the instructor has the Allow +/- Grades box checked.