When the user initially opens the pie chart to view grades, the user will see the display in Figure 2.6.2.1 or Figure 2.6.2.2. If the user is an instructor, the user will see the display in Figure 2.6.2.1. If the user is a student, the user will see the display in Figure 2.6.2.2.
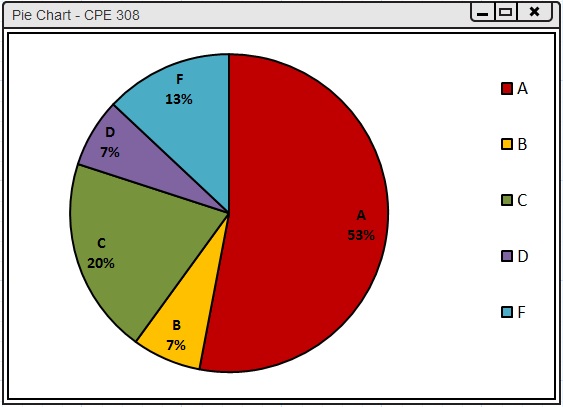
Figure 2.6.2.1: Pie Chart--Instructor View.
The initial instructor display consists of one window: a pie chart of the tabulated student course grade data. The pie chart is synced with the current student grades (the spreadsheet), the histogram, and the curving tool changes. The pie chart displays the letter grade slice with the percentage of students who have that letter grade. The user can modify the slice sizes by manually adjusting each slice by dragging it inwards/outwards.
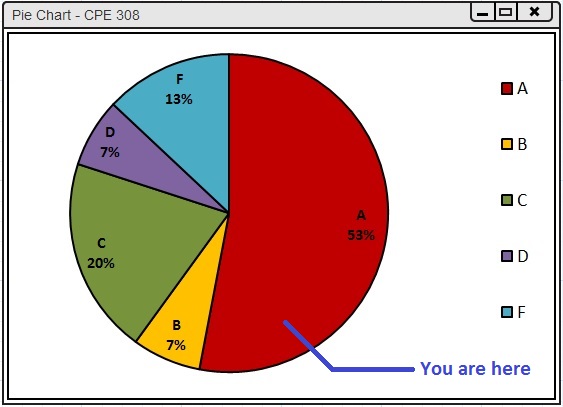
Figure 2.6.2.2: Pie Chart--Student View.
The student view of the pie chart differs slightly from the instructor view. There is a line that indicates the user's current rank in the class. The line has a label titled You are here. This feature allows students to see where they are ranked in the class compared to everyone else. Students also cannot adjust the letter grade cutoff slices. Thus, students cannot adjust the curve.