
The insert percentage curving mechanism allows the user to manually input the lower percentage boundary for each letter grade. This curve is useful if the user wants a concrete percentage breakdown for each letter grade. For example, a lot of teachers grade based on the 90-80-70-60 percentage breakdown. This specific breakdown is modeled in Figure 2.6.3.3.1 below.
Figure 2.6.3.3.1: Curving: Insert Percentage.
The insert percentage curving window is comprised of three main pieces: the instructions box, percentage input column, and the Apply Curve button.
The instructions box reaffirms the purpose of this curving mechanism. It reminds the user to input the lower bound percentage for each of the letter grades. Then once the user is content with the percentage breakdown, the user should click the Apply Curve button.
The percentage input column allows the user to manually input the lower bound percentage for each letter grade. There is a row for each possible letter grade. These rows contain the letter grade heading for each letter grade as well as a percentage input box for each letter grade.
The Apply Curve button will set the given lower percentage boundaries to the specified letter grade.
This will modify the histogram, pie chart, and spreadsheet contents to match the new curve.
The resultant histogram, pie chart, and spreadsheet are shown in Figure 2.6.3.3.2.
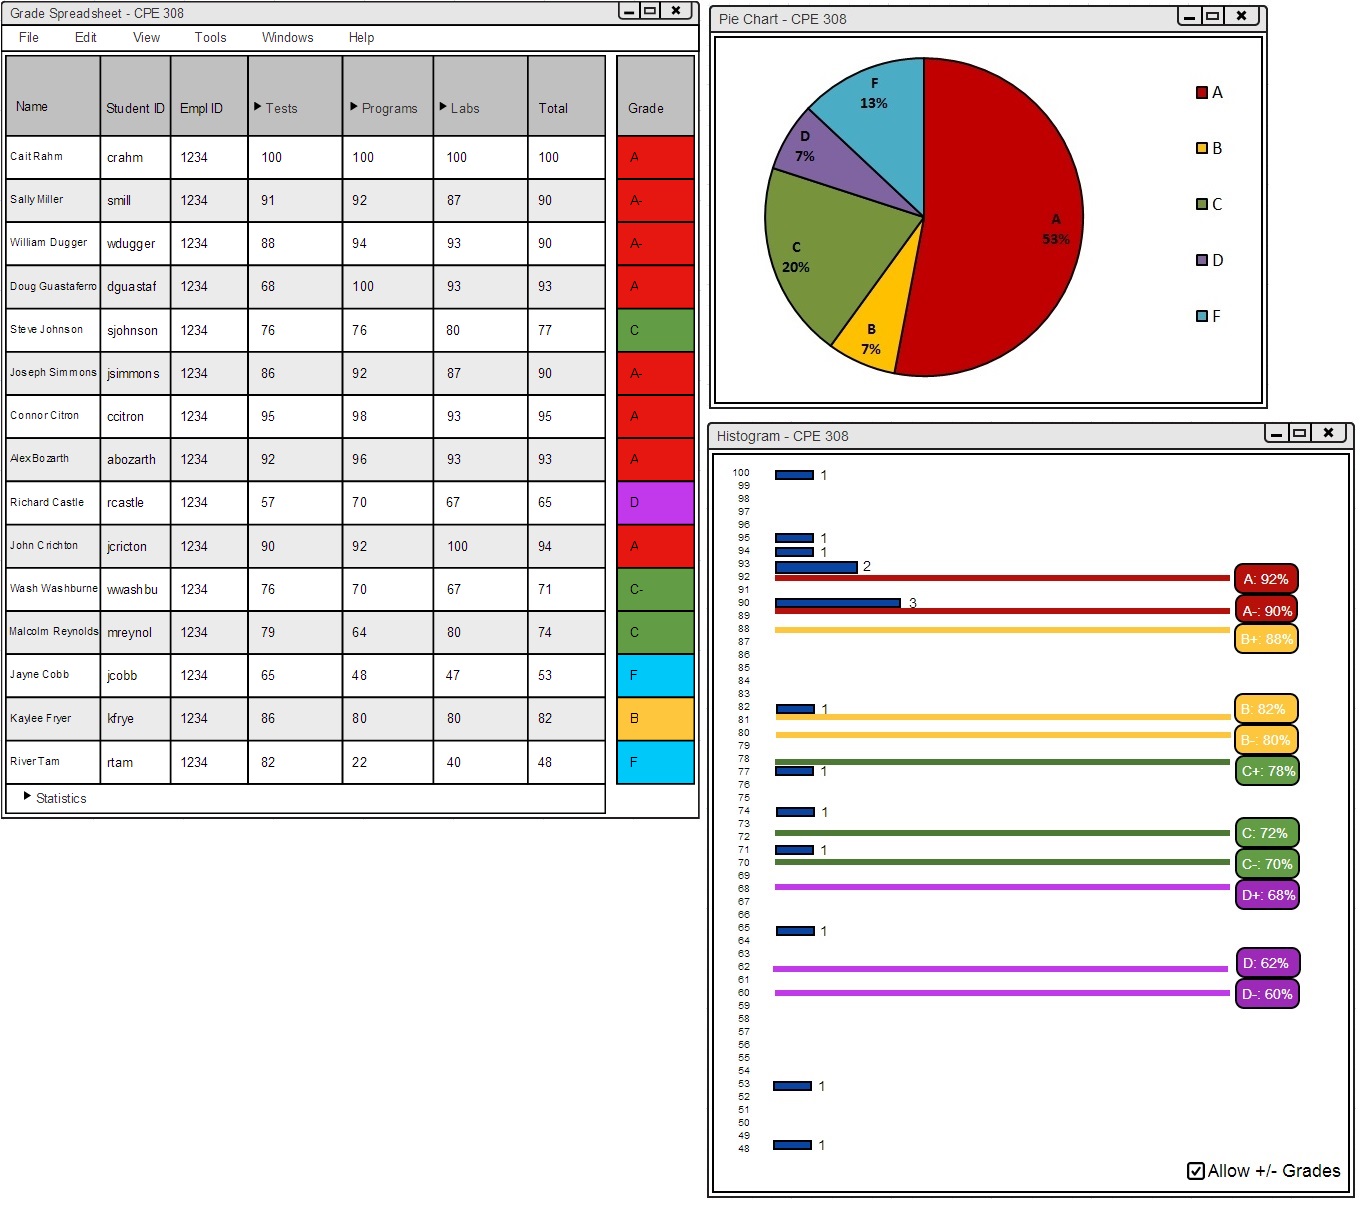
Figure 2.6.3.3.2: Apply Curve: Insert Percentage.