![]()
Students are able to fill in values for assignments and tests in the spreadsheet that have not been taken yet to see what grades they need in order to get a particular grade in the class.
Figure 2.7.3.1 shows the spreadsheet with the two tests blank. The student can
enter a number to predict their grade by clicking in the blank box under Test.
Every value is the percentage the student recieved for each assignment. Blank columns
are ignored by the Gradebook in the Total and Grade columns.
![]()
Figure 2.7.3.1: Spreadsheet with blank.
After the student types in a value and presses the 'Enter' key, the spreadsheet updates the Total
and Grade columns. Figure 2.7.3.2 shows the spreadsheet after the student has entered
a grade for Midterm 2 and has typed in a number under Test, but has not pressed the 'Enter'
key yet. The Total and Grade have adjusted for the Midterm 2 value. The filled in values
are blue to make them stand out in the spreadsheet.
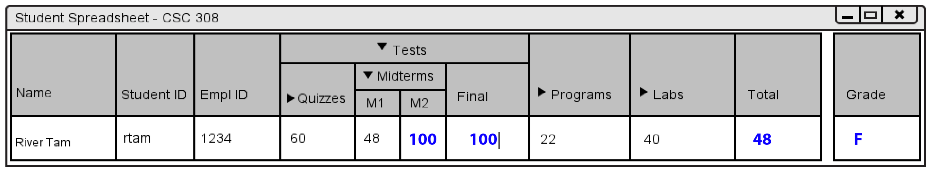
Figure 2.7.3.2: Spreadsheet with blanks partially filled in.
The Grader Tool calculates the new Total by converting the given percentage into a numerical value using the total points for that category and including that column into the Total value. The Grader Tool references the curve, set by the instructor, to figure out the letter grade that goes into Grade.
Figure 2.7.3.3 shows the spreadsheet after the student enters grades into the blanks.
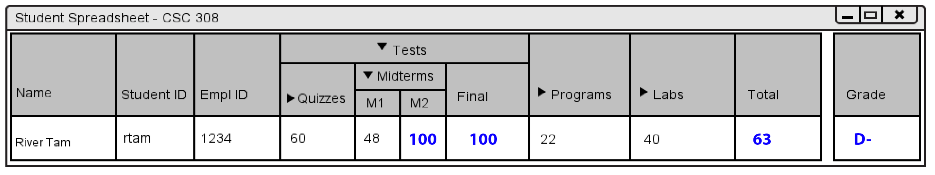
Figure 2.7.3.3: Spreadsheet with blanks filled.
Figure 2.7.3.4 shows the spreadsheet after the student enters grade(s) into the
spreadsheet that are higher than the points for that assignment. The Total and Grade
columns still calculate correctly. This allows for extra credit if the student gets
more than a 100% on an assignment. Values higher than 100% are colored red.
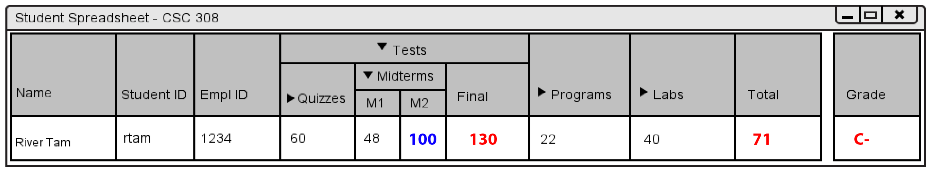
Figure 2.7.3.4: Spreadsheet with impossible grades.