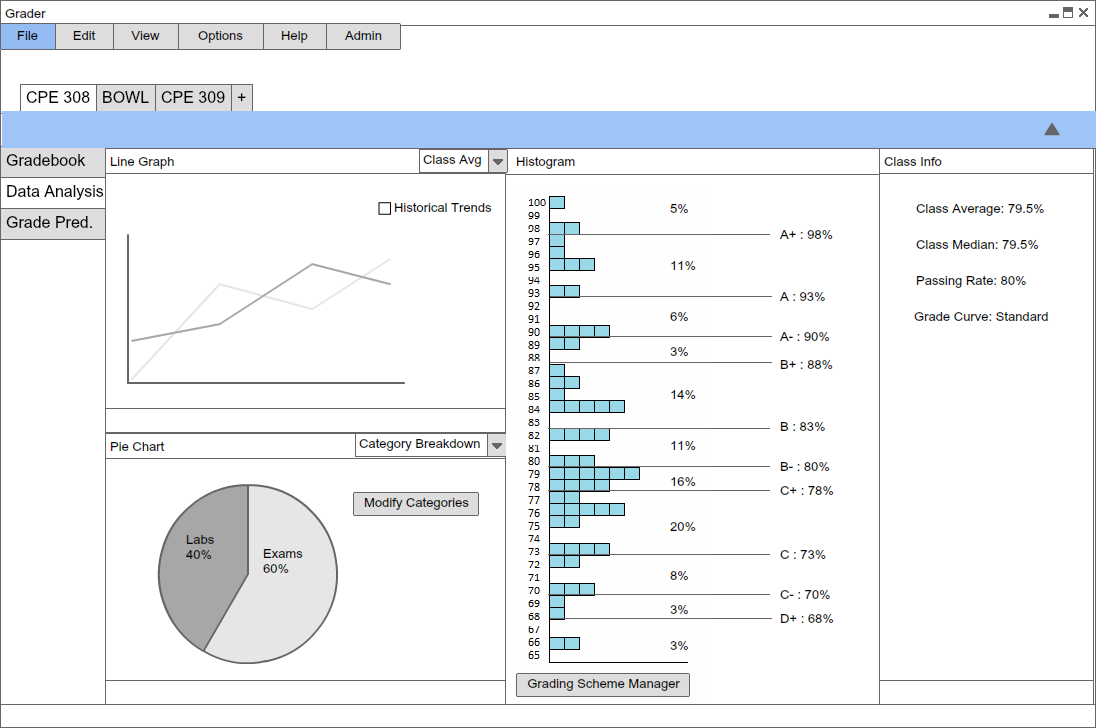
The data and analysis page is what truly sets us apart from most other grading softwares. A seperate page within the individual class tab, the data and analysis page provides plenty of space to display data through both graphs and numbers.
Data can be provided in raw numbers, giving numbers such as pass rate, class average, etc. Data can be visualized using pie and line graphs.
The histogram is the crowning feature of the data page. It turns a static data page into a powerful dynamic tool by allowing the professor to modify grade values by simply moving the grade letter seperation lines and therefore change the curve.
The histogram will be update in real time, providing accurate information on definitons of grade values, percents of student in each letter, etc.
Each student in the histogram will be represented as one box that, when clicked, will open a small text box about the student, providing data and figures such as exam average, etc.
In addtion, the professor can toggle on a bell curve that will be superimposed over the histogram, displaying the spread out of grades in the class.
The pie chart is another dynamic tool, displaying things such as the categories for grades such as exams, quizzes, etc. Directly in the pie chart box, the user can open a window to modify the grade categories. The changes will immediately be presented on the pie chart.
The line graph provides information such as class average, median, passing rate, etc. Historical trends can be toggled on to display information from previous quarters.
Finally, there is the class info section that provides raw data, with no graphical representation. Numbers such as passing rate class average, median, grade curve type, etc. When changes are made using the pie chart and histogram, the values will be updated accordingly.
Unlike many other grading software, the data and analysis page is not merely a page to view information, but a comprehensive, efficient and effective graphical tool to control grade curves and modify grade spreads to meet the needs of the professor.
Figure 6: Data & Analysis Page