Figure 2.5.2.1: Initial pie chart view.
A user opens the pie chart tool by going to Tools->Graphs->Pie Chart. The tool is used to adjust the grading scheme of the class. Figure 2.5.2.1 shows the initial view of the pie chart tool window.
Figure 2.5.2.1: Initial pie chart view.
Each section of the pie chart is labeled with a letter grade and the number of students who have that grade. Each section is separated by a draggable line that lies on the percentage boundary between letter grades. After adjusting the grading scheme, the user clicks the Save button to make the changes. To discard any changes, the user clicks Cancel.
Figure 2.5.2.2 below shows basic adjustment of the grading scheme.

Figure 2.5.2.2: Adjust sections by dragging boundary lines.
If a boundary line is moved, the percent ranges of the two grades that it divides changes. In the example above, the grading scheme has been adjusted so the lower bound for an A is lower, which results in more A's. Moving this boundary does not affect any other boundaries. The lower bound for a B remains the same, so now there are less B's.
If the instructor allows plus or minus grading, the checkbox for Use +/- Grading is enabled, as shown in Figure 2.5.2.3.
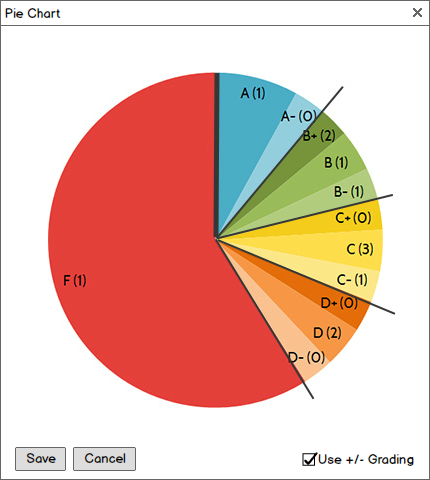
Figure 2.5.2.3: More sections after checking Use +/- Grading.
When the Use +/- Grading option is checked, each letter grade section is visually divided into more sections, as they are in the histogram tool. The boundaries for the subsections are automatically calculated and drawn, but only the boundaries for the main sections can be adjusted by the user.
Figure 2.5.2.4 below shows the pie chart tool if the gradebook is using an alternative grading scheme that does not allow plus or minus grading.
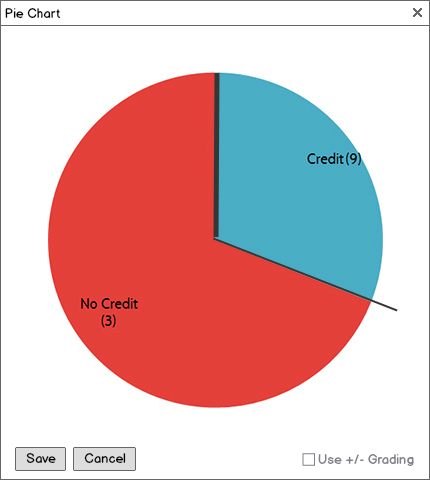
Figure 2.5.2.4: Sections with alternative letter grades.
Because the grading scheme does not allow plus or minus grading, the Use +/- Grading option is disabled.
When a boundary overlaps with another boundary, letter grades are merged. Figure 2.5.2.5 shows the pie chart when a user merges two sections.
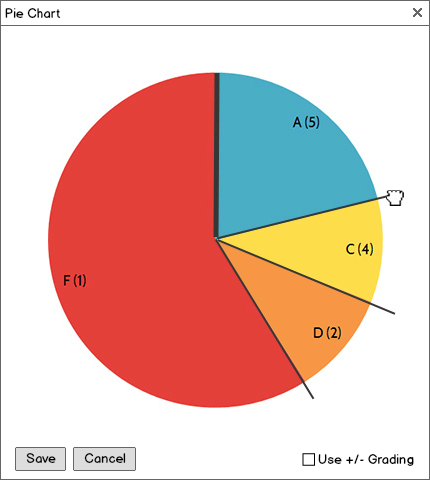
Figure 2.5.2.5: Merge sections by dragging one boundary line into another.
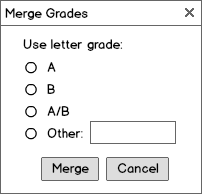
The lower boundary for an A is dragged into the lower boundary for a B. The boundaries can't cross, so they merge into a single boundary. When the user is done dragging, a dialog will pop up with options for labeling the merged letter grade, shown in Figure 2.5.2.6 and Figure 2.5.2.7.
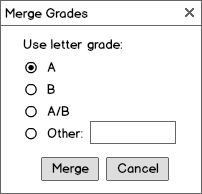
There are three suggested letter grades for the merged section: the letter grade of the first section, the letter grade of the second section, and a combination of the two grades (separated by a slash). You can also name it something else in "Other." In Figure 2.5.2.7, the first letter grade is chosen to be used.
If the user clicks Cancel, the sections do not merge and the boundary reverts to its position before being dragged.
To split this or another section back into two sections, the user opens the Split Grades feature by right-clicking the section to be split, as seen in Figure 2.5.2.8.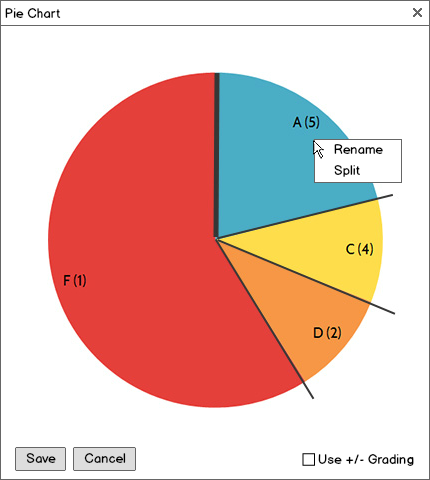
Figure 2.5.2.8: Right-click context menu of pie chart section.
If the user clicks on Split in the context menu, a dialog will pop up with options for how to split the section. This dialog is shown below in Figure 2.5.2.9.
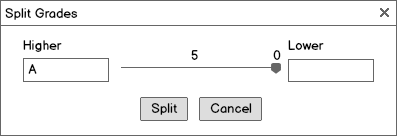
Figure 2.5.2.9: Letter grade splitting dialog.
The dialog has a horizontal slider and labels on both ends. The Higher letter grade is the section that is above the new boundary, while the Lower letter grade is the section that is below the boundary. By default, the Higher letter grade is the current letter grade of the section. The slider determines how many students will fall under each section. The counts are shown above the slider.
Figure 2.5.2.10 below shows the dialog filled in so that the grading scheme reverts to how it was before the merge.
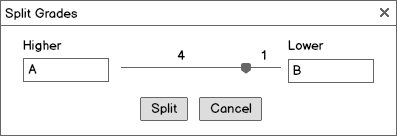
Figure 2.5.2.10: Split Grades dialog with original settings filled in.
After splitting the section, the pie chart looks like Figure 2.5.2.2 again.
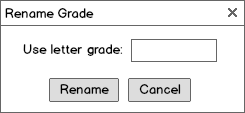
Finally, the user has the ability to rename sections using the pie chart tool. The user does this by right-clicking the section to access the context menu (as in Figure 2.5.2.8) and selected Rename, which brings up the dialog in Figure 2.5.2.11.
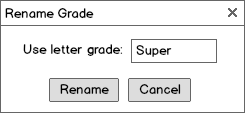
The user specifies what label to use for the letter grade here and clicks Rename to make the change. If the dialog is filled in like Figure 2.5.2.12, the pie chart will be updated with the new label, as seen in Figure 2.5.2.13.
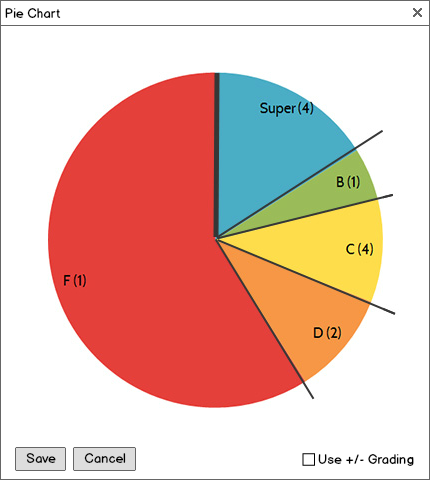
Figure 2.5.2.13: Letter grade A is renamed to Super.