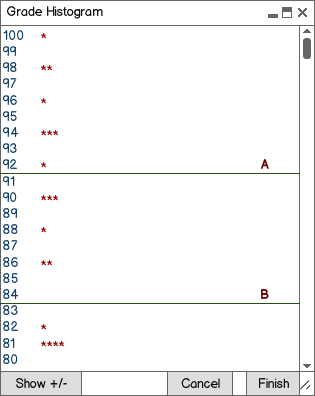
Figure 2.5.1.1: The initial Histogram window.
The Grader has two tools for manipulating the grading scheme of a course.
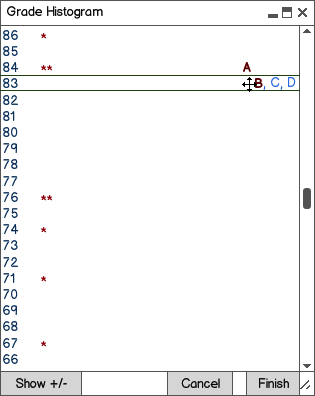
From the Tools menu, a user can choose Graphs and then decide between viewing grade statistics on a Histogram or Pie Chart. If the user decides to choose Histogram, Figure 2.5.1.1 shows the initial Grade Histogram window.
Figure 2.5.1.1: The initial Histogram window.
The Grade Histogram has two columns: The score column on the left, and the Grade column on the right. The score column is a representation of what percentages match which grade. The respective grade on the right hand side is the grade column. Upon hovering the mouse over any point on the horizontal bar, the cursor will change to a drag icon, as shown below in Figure 2.5.1.2
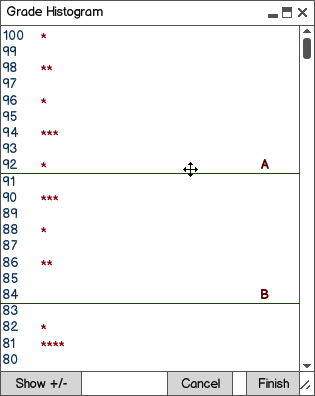
Figure 2.5.1.2: Upon hovering over any grade set bar, the mouse will
switch to a drag cursor.
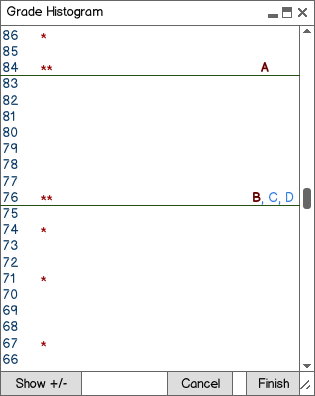
Once the grade set bar has passed half of the height of a left hand side number, said number will automatically move to the opposite side of the 'grade set bar'. For example, if the grade set bar for an A grade moves from below 94% to above the mid-height of the 94, the 94 will appear below the bar. This causes a 94 to now be a B letter grade. This allows the instructor to drag and drop the line, thereby setting the grade curve for the class. Example pre and post drag windows are below in figures 2.5.1.3 and 2.5.1.4
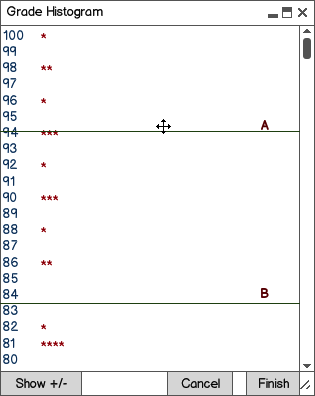
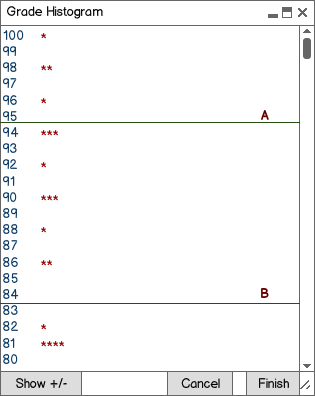
Figures 2.5.1.3 and 2.5.1.4: Pre and post drag
By holding down the mouse over the bar, a drag resulting in positive or negative y-axis movement will cause the grade set bar to move either up or down respectively. The user can also accomplish "combining" grades by dragging a bar into another bar. Figure 2.5.1.5 shows a Histogram bar being dragged into another bar.
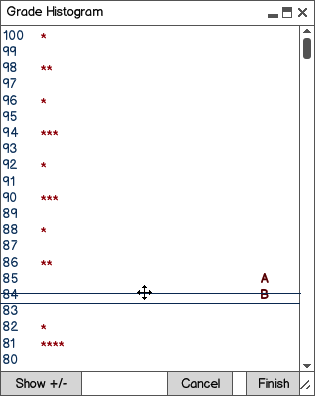
Figure 2.5.1.5: Pre grade combination.
Dropping a bar onto another bar will cause the higher letter grade to become associated with the number that it was dragged onto, and the lower letter grade to become nonexistent. In our example, an A is now an 84 and above, and a B no longer exists. An alert message, as shown in Figure 2.5.1.6 below, conveys this convention of bar combination.
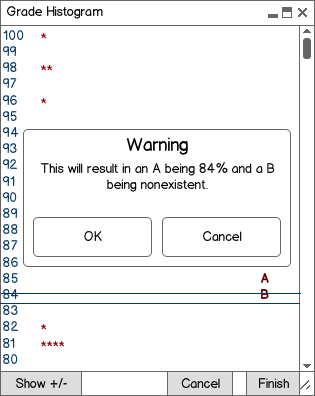
Figure 2.5.1.6: An alert message before combining grade set bars.
Finally, the grades are combined, and the B becomes a light blue color to convey that it no longer exists. Refer to Figure 2.5.1.7 below to see the result.
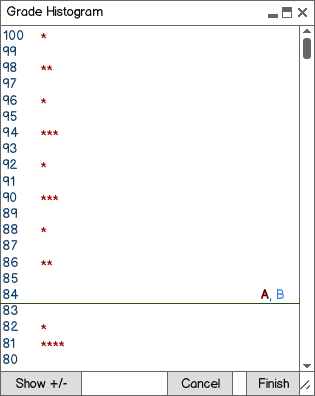
Figure 2.5.1.7: The screen conveying that a B no longer is possible to obtain, and an A is an 84%.
Suppose that the user wished to combine the A, B, C, and D grade into one percentage, as in a pass/fail class. The 'A' shall supercede all lower grades, and the percentage corresponding to the position of the grade bar shall set grades 'A' through 'D' to that percentage. Figure 2.5.1.8 below, demonstrates the ability to relate many grades to one percentage. In this case, a pass is an 84%, and any lower grade shall result in failing the class.
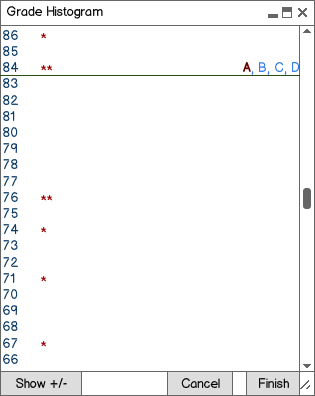
Figure 2.5.1.8: The result of combining an A, B, C, and D grade into one grade bar.
If the user wished to separate a group of grades from the combined 'pass' bar, they can do so by hovering their mouse over and dragging a specific letter away from the bar, as shown below.
Figures 2.5.1.9 and 2.5.1.10: Separating the 'B' grade from the combined A, B, C, D grade bar.
The initial drag will result in the letter which the user hovered over, in this case the 'B' letter, regaining it's 'active color' and boldness indicating that the letter grade is now existent again. Separating the B grade results in all lower grades also moving with the B grade bar, and the end result of the example is an 'A' grade being an 84%, a 'B' grade being a 76%, and all lower grades resulting in failure of the class.
The Show +/- button allows for editing of 'plus' and 'minus' grades, if the instructor has implemented pluses and minuses. Figure 2.5.1.11 below displays the window upon clicking this button.
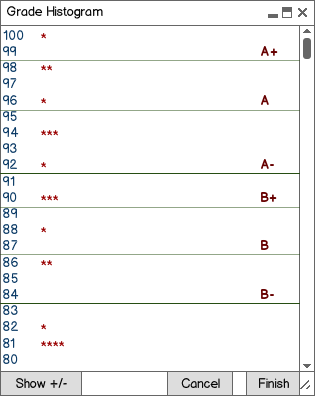
Figure 2.5.1.11: The show +/- menu shows possible letter grades for each score along with a + and - for each letter.
The Grading Histogram default gap between a letter grade and it's respective + or - will be computed by dividing the space between the current grade and the next grade by three, unless otherwise specified by the instructor. After this computation, the instructor is free to drag the plus and minus icons as he or she chooses.
Grade drag and drop is still enabled, with the same limitations as basic histogram. Student access results in no change to the actual grade curve, as with basic histogram. Another example of a limitation is shown in Figure 2.5.1.12 below. The user attempts to set an A+ grade to a 94% while an A grade is still at 96%.
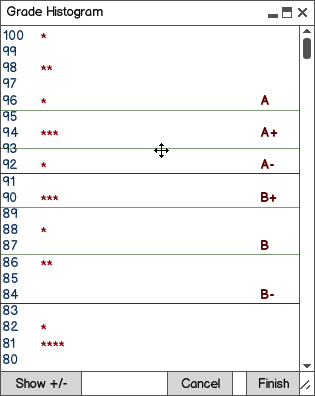
Figure 2.5.1.12: An illegal drag.
In this case an alert message notifies the user that a higher grade may not be dragged beneath a lower grade. This feature is also included in the basic histogram.
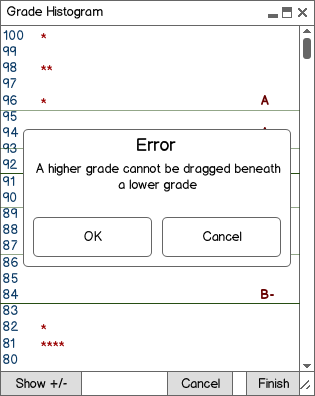
Figure 2.5.1.13: A resulting error message.
Another example of an illegal drag is a horizontal drag, specifically off the window of the Grading Histogram. An example is shown in Figure 2.5.1.14 below.
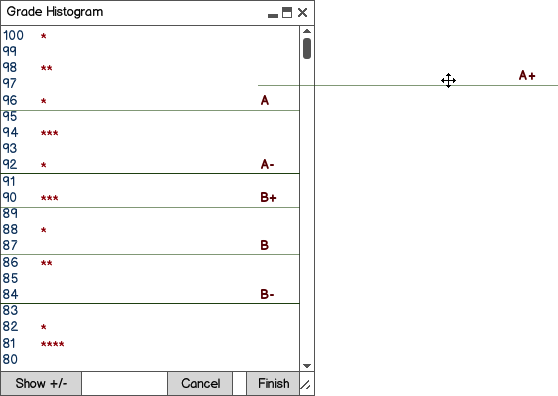
Figure 2.5.1.14: A drag out of the window.
In this case, the grade set bar will simply snap back to it's original position.