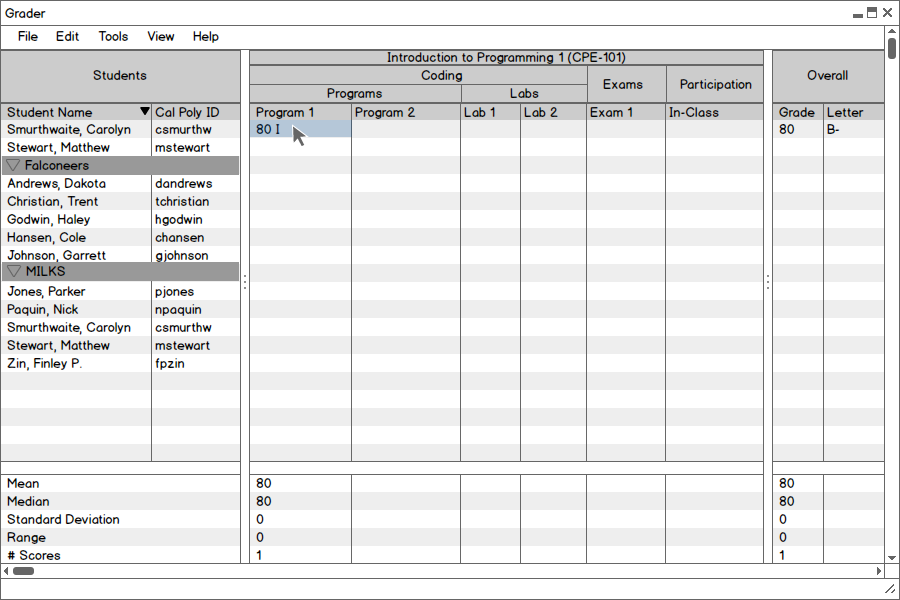
Figure 2.6.1: Adding a score to the gradebook.
Once the user has added assignment categories, created individual assignments, and imported/manually added students, he or she may begin adding scores to the gradebook. Note that empty scores (cells) in the gradebook do not affect students' grades. An empty cell behaves differently than a score of "0". All of the students begin with no overall score or grade; this will change automatically as scores are added to the gradesheet.
When the user clicks on an individual cell corresponding to an assignment for a particular student, a cursor appears and the user may edit the value in that cell. Upon entering a score the Overall column and the Statistics Drawer will automatically be updated to reflect the new grade information.
Figure 2.6.1: Adding a score to the gradebook.
As shown in Figure 2.6.1, the user has entered a score of 80 for the "Program 1" assignment for student Carolyn Smurthwaite. Since this is the only score for Carolyn so far, her overall grade is now 80 as well, a "B-" with a traditional grading scheme. Likewise, this is the only score for the "Program 1" assignment, and the Statistics Drawer at the bottom of the gradebook reflects this with a mean score of 80, etc.
As the user fills the gradebook with more grade data, the Overall column and Statistics Drawer continue to update automatically. Note that the Statistics Drawer presents information about the mean assignment score, median assignment score, standard deviation of scores, range between the maximum and minimum score, and finally the number of scores entered so far for that assignment. The next figure illustrates this:
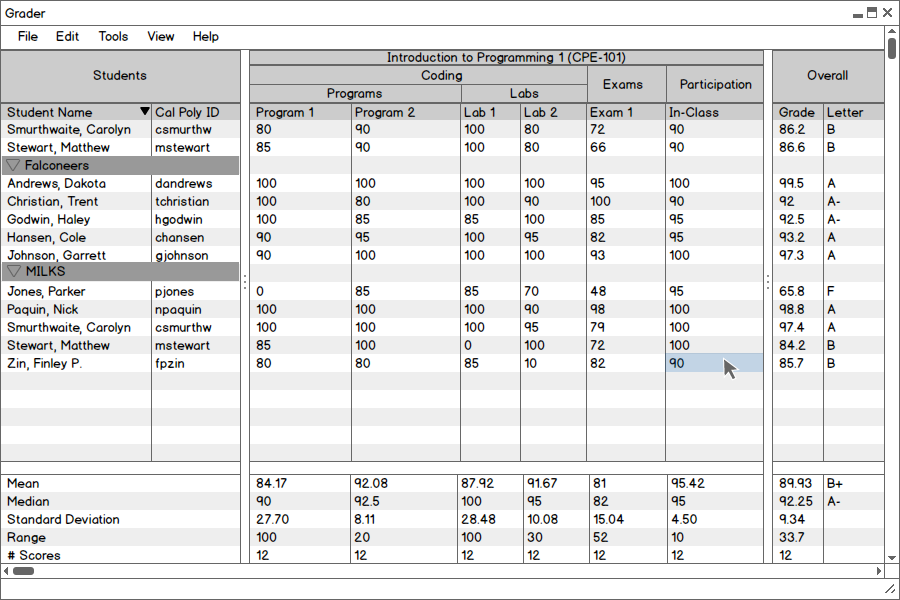
Figure 2.6.2: The gradebook with several scores added.
Note that just like other spreadsheet programs, Grader allows the user to add, edit, and delete cell values. As mentioned earlier, a blank cell (resulting from the deletion of a score) will not hurt a student's overall grade. Instead, that assignment will no longer be counted when calculating the student's overall grade and that assignment's stastistics.
Grader provides some distinct features for interacting with spreadsheet rows and columns: the user expands and collapses assignment categories (columns) and student groups (rows) to adjust the level of depth of grades presented. This is a useful way to fit more information about how the class is doing as a whole (or how certain groups are performing) into a smaller screen area.
When the user clicks on an assignment category column header, the assignments belonging to that category will be collapsed into one assignment column (denoted with a *), and the average score for that collection of assignments will be displayed for each student.
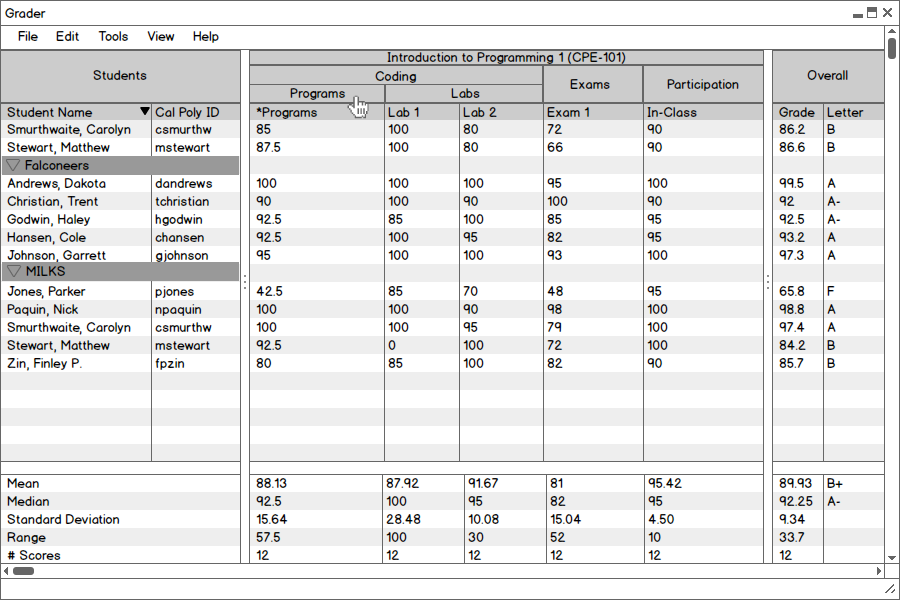
Figure 2.6.3: Collapsing an assignment category column.
Here, the assignments in the Programs category are now hidden. The instructor sees how each student is doing on average with assignments in the Programs category. The corresponding column in the Statistics Drawer also collapsed and computes statistics for the mean scores of the category. The Overall Grade column is unaffected by column-collapsing.
The user interacts with student groups in the same way. Instead of clicking on an assignment category header, the user clicks on a student group name. When the user does this, all of the students associated with the clicked student group will be collapsed into a single row representing the group as a whole, as Figure 2.6.4 illustrates. Note that both a column and row are collapsed -- the user may collapse both dimensions of the gradesheet at the same time.
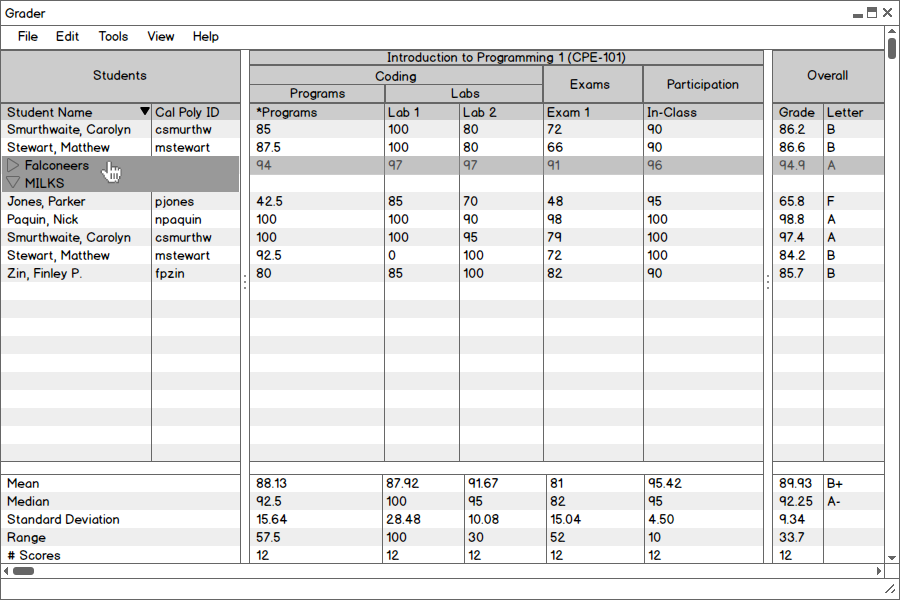
Figure 2.6.4: Collapsing a student group row.
The Falconeers group is collapsed after the user clicks on it in the Students column. The five students are no longer directly visible. Instead, the average score of those five students is displayed in one row. The Statistics Drawer and Overall column remain unaffected by the collapsed student group; they still display information based on individual scores for all assignments. By collapsing student groups, the user gets a quick look at how a group is doing, and also clears up more rows that the system fills with more students/groups so the user doesn't have to scroll down to view them.
Like other spreadsheet programs, Grader allows for sorting by column value. When the user clicks on a column header, the system sorts the gradebook based on that column's values. Figure 2.6.5 shows this.
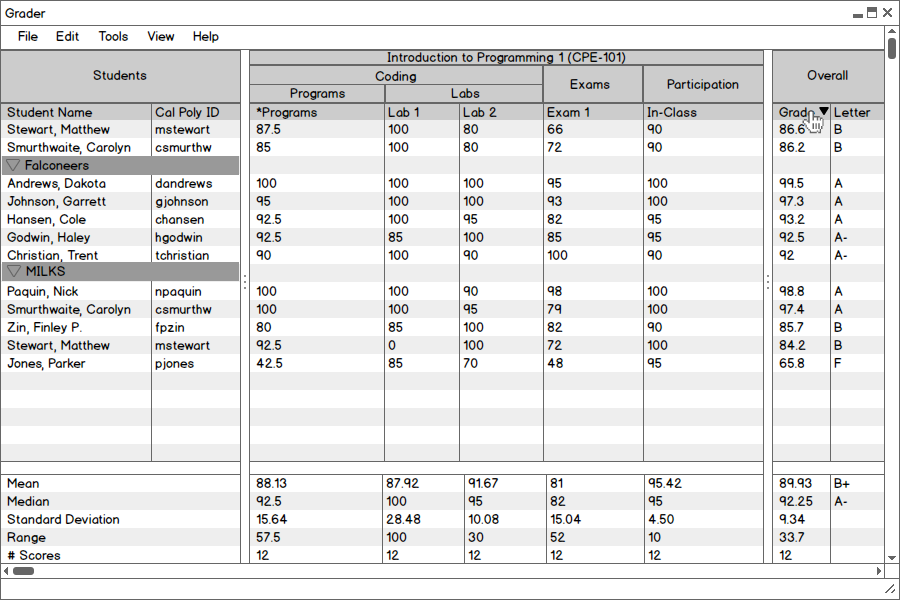
Figure 2.6.5: Sorting the Overall Grade column.
The user clicks on the Grade column header in the Overall category, and student rows are sorted accordingly. Because the user has sorted some students into groups, the groups are not disrupted. Instead, students are sorted in-place within their groups.
Note that the user clicks on a column header to sort the data, but does not click on a column "category" header. As discussed in Section 2.6.2, clicking on a category header will collapse and expand a column. To use Grader's sorting features, the user must click on the actual column header, located below any category headers.
The Grader tool has access to all student information downloaded from PeopleSoft. By default, this information is not all shown. The user may manually choose which Student Information categories to display by choosing the Student Information option from the View item in the menubar (See Figure 2.1.3). When the user selects the Student Information item, the following dialog opens:
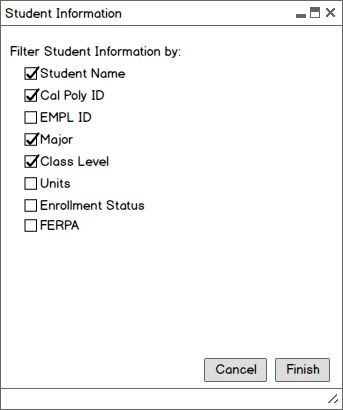
Figure 2.6.6: Choosing which Student Information categories to display.
The user selects available Student Information categories to display by checking the boxes corresponding to each category. The user clicks Cancel to abandon the dialog menu and return to the gradebook in its previous state. Otherwise, when the user clicks Finish the gradebook will be updated to show the selected categories. Figure 2.6.7 shows the gradebook with the Student Name, Cal Poly ID, Major, and Class Level Student Information categories shown.
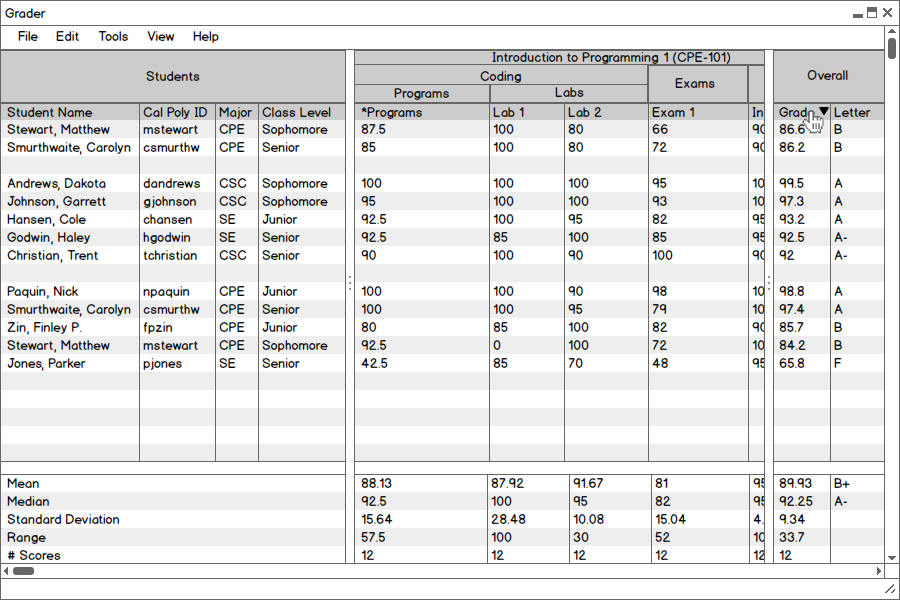
Figure 2.6.7: The Students category after filtering.
Note that the central gradesheet table has been shifted over to make room for the extra student information. In order to view assignment scores that have shifted off-screen, the user scrolls horizontally using the scrollbar at the bottom of the window.