2.6.3 Changing the Curve
Anything the teacher does in this section can be done in prediction mode by students. See section 2.7.3 on how to enter prediction mode. Any changes made while in prediction mode do not change any actual grades. It only allows students to see what their grades could be.
The teacher can adjust the curve of the class by selecting ‘Tools’ in the menu bar and then ‘Curve Adjuster’ which will bring up the window in Figure 2.6.3.1.
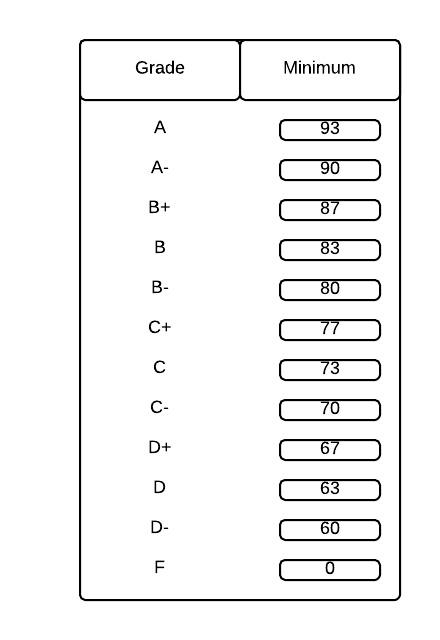
Figure 2.6.3.1
By double clicking any number, the teacher can change the minimum value of any grade, down to the value of the grade below it. The main view will also change its letter grade if applicable after a curve adjustment. If the teacher changes the value of an ‘A-’ to 88, the main view will change to Figure 2.6.3.2.
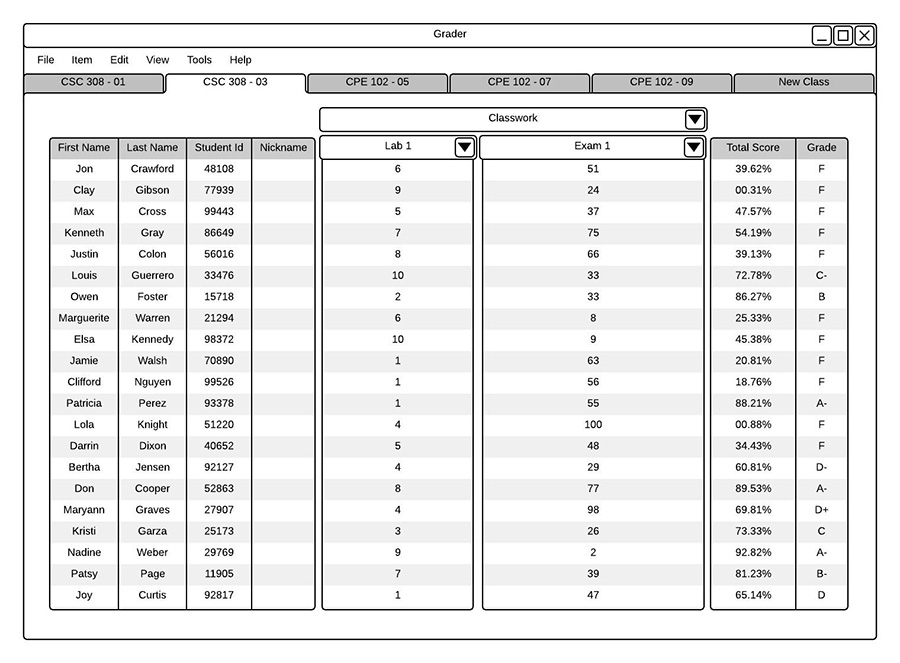
Figure 2.6.3.2
The teacher can also use the histogram to change the curve of the class. To view the histogram, the teacher selects ‘Tools’ from the menu bar then ‘Histogram’.
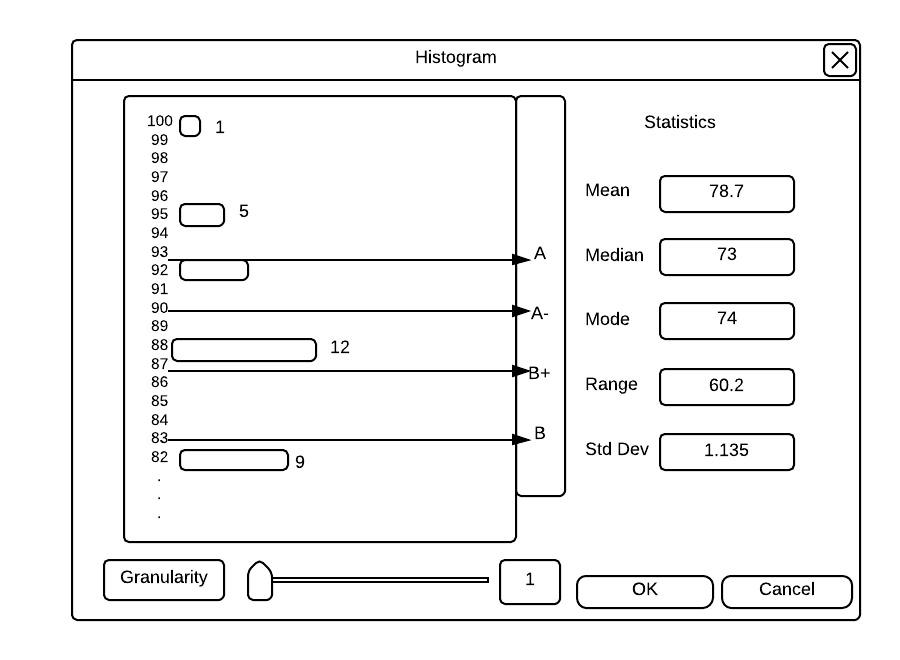
Figure 2.6.3.3
The teacher changes the curve by dragging any of the arrows up or down, as far as the arrows below or above it. For example, when the teacher drags the arrow labeled ‘A-‘ down to 88 shown in Figure 2.6.3.4, it will have the same effect on the main view as in Figure 2.6.3.2. If the teacher continues to drag the arrows past another line next to it, that line will then start to move too. If this happens, the letter grade that was between those two lines will get removed and placed on top of the arrow. To seperate the arrows, click and drag the letter instead of the arrow.
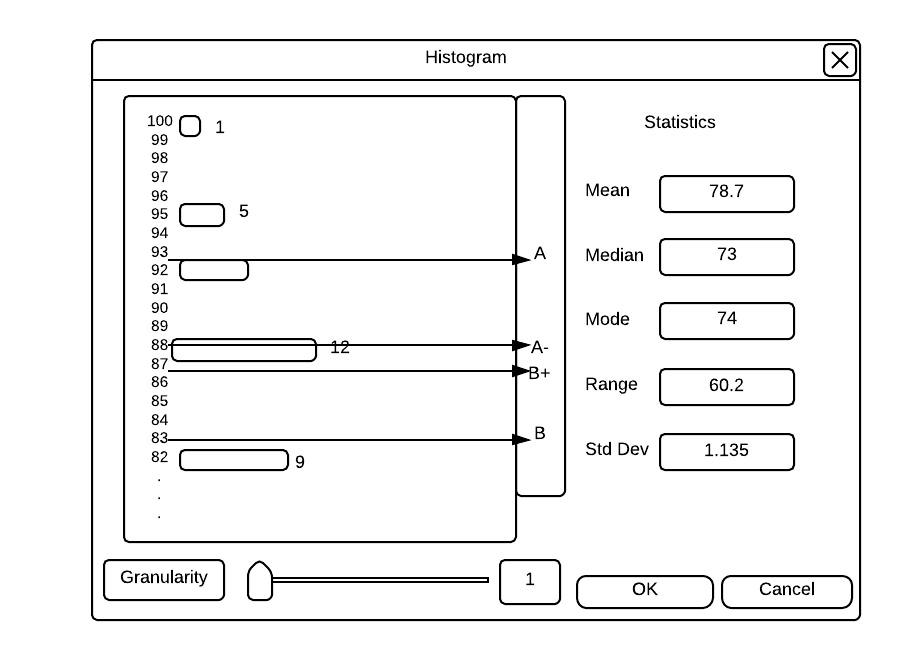
Figure 2.6.3.4
Figure 2.6.3.5 shows what happens when the teacher drags the B+ line up to a grade of 96. Doing this will get rid of all the A- and B+ grades and changing them to B.
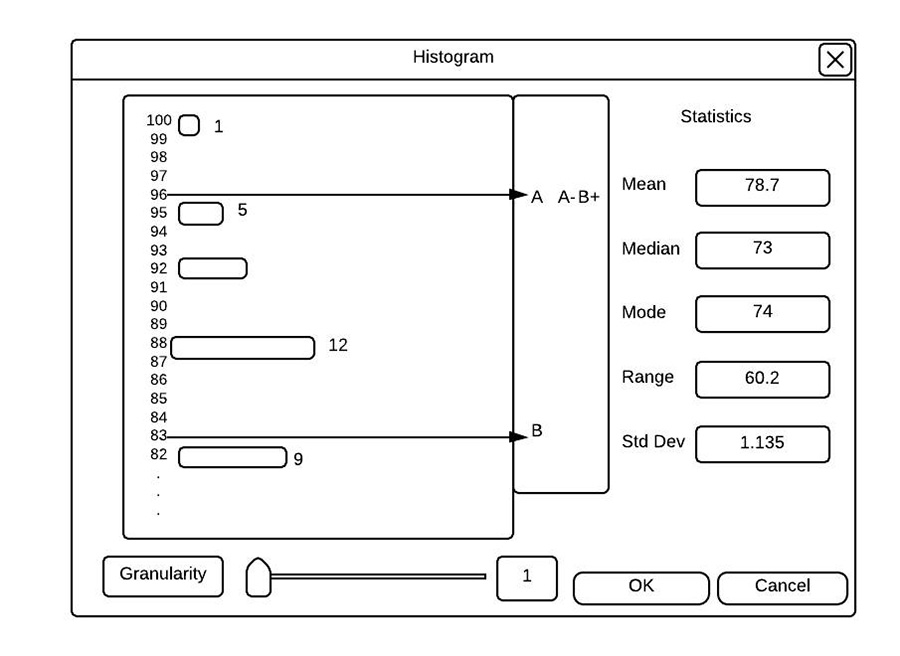
Figure 2.6.3.5
The teacher also uses the pie chart to change the curve of the class. To view the pie chart, the teacher select ‘Tools’ from the menu bar then ‘Pie Chart'.
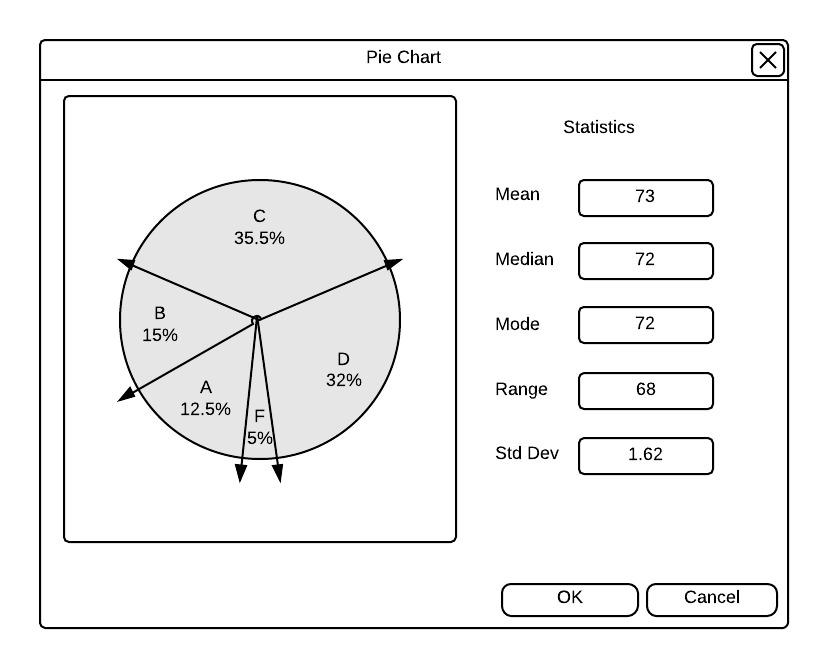
Figure 2.6.3.6
The teacher changes the curve by dragging any of the arrows around the chart up to the arrows next to it. For example, when the teacher continues to drag the arrows past another line next to it, that line will then start to move too. If this happens, the letter grade that was between those two lines will get removed and placed on top of the arrow. To seperate the arrows, click and drag the letter instead of the arrow. Figure 2.6.3.7 shows the effect of lowering the minimum value of a ‘B’ grade.
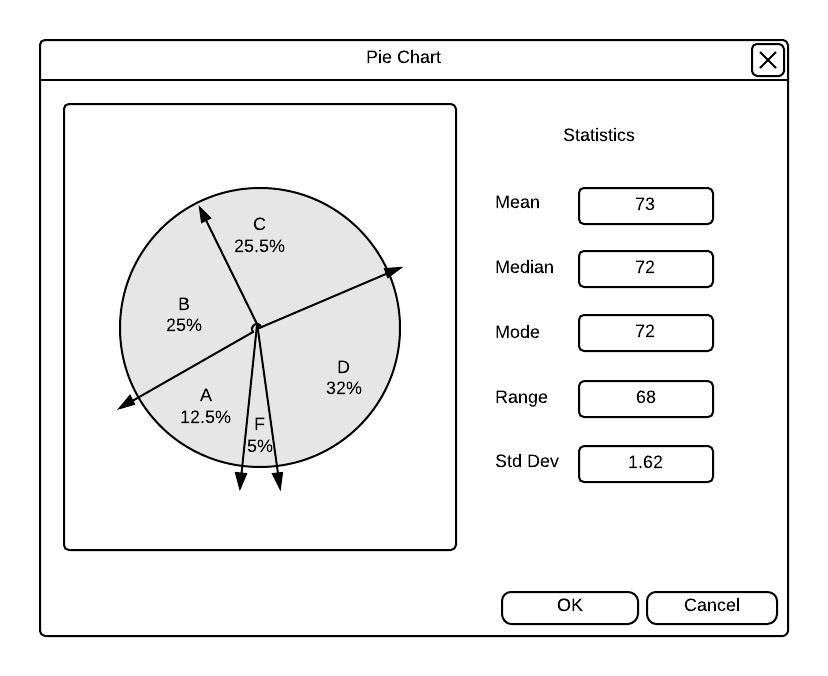
Figure 2.6.3.7
Figure 2.6.3.8 shows the effect of lowering the minimum value of a 'B' grade all the way to the next line.
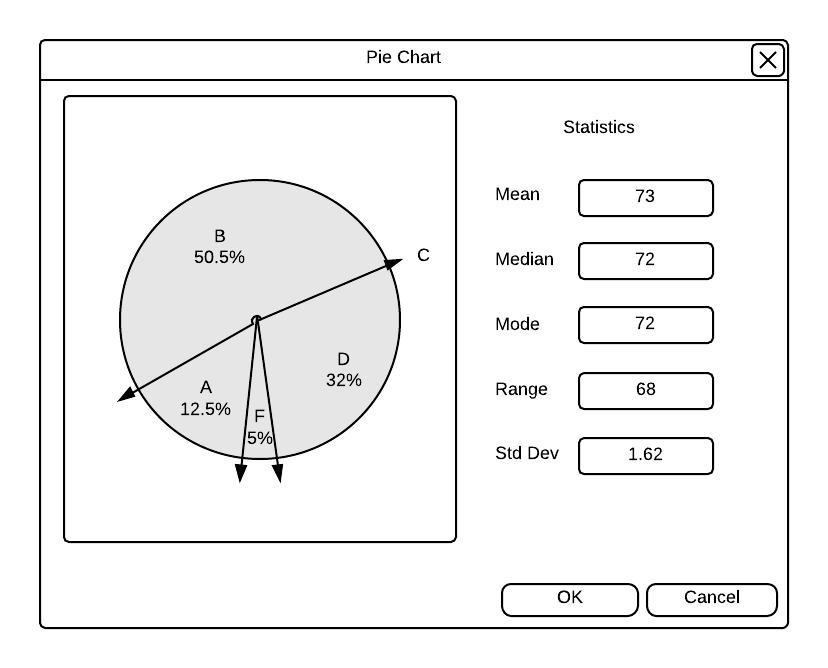
Figure 2.6.3.8
As with the histogram, any changes made to the pie chart will affect the main view letter grade if applicable.