In response to clicking Tools on the main menu bar and then Pie Chart on the drop down menu, the system displays the window shown in , assuming there are no students added yet. To populate a class with students see Section 2.3.
The statistics bar on the right is the same as the histogram explained in Section 2.6.1. In this tab, the data is represented as a pie chart.
Initial Pie Chart View.
is a fully populated Pie Chart with the appropriate statistics in the input fields.
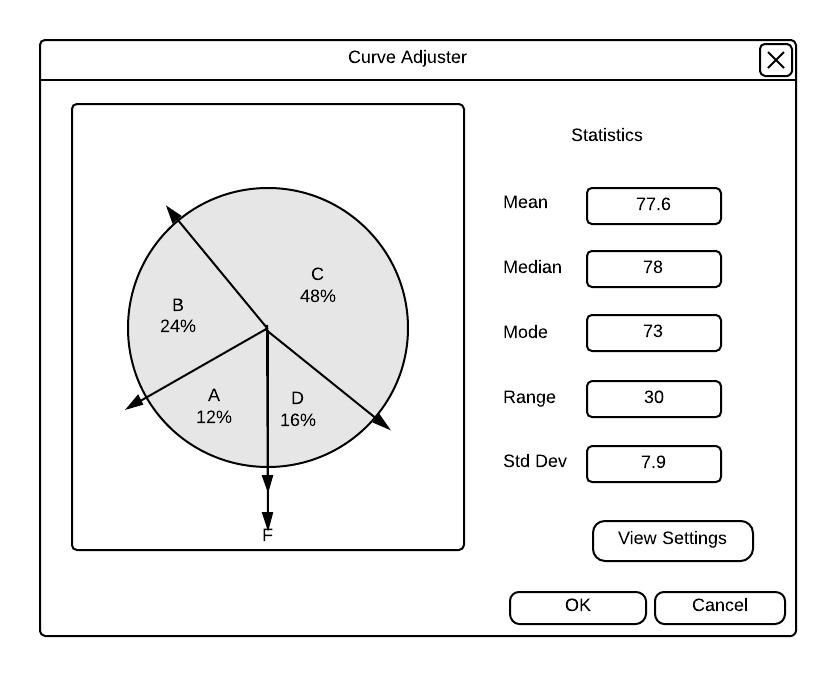
Populated Pie Chart View.
Note: For the interaction with the graphs and how it interacts with the gradebook, refer to Section 2.7.