In response to clicking Tools on the main menu toolbar and then Histogram on the drop down menu, the system displays a window shown in , assuming there are no students added yet. To populate a class with students see Section 2.3.
There is an interactive histogram to the left, a granularity slider on the bottom, and a list of major statistics to the right. These statistics are simply output boxes and cannot be modified.
Initial Histogram View.
Users are able to change the granularity of the histogram via the slider. The input field next to the slider will change as the slider changes. For example, when the slider is at the left-most position, the input field will read 1. Because this is an input field, it takes in an integer between 1 and 20, which will adjust the slider and the histogram.
When a user changes the slider to a small enough granularity so there is enough room, the histogram will automatically adjust the letter grades shown into borderline grades of + and -. See Section 2.7 to see this in action.
shows a fully populated histogram.
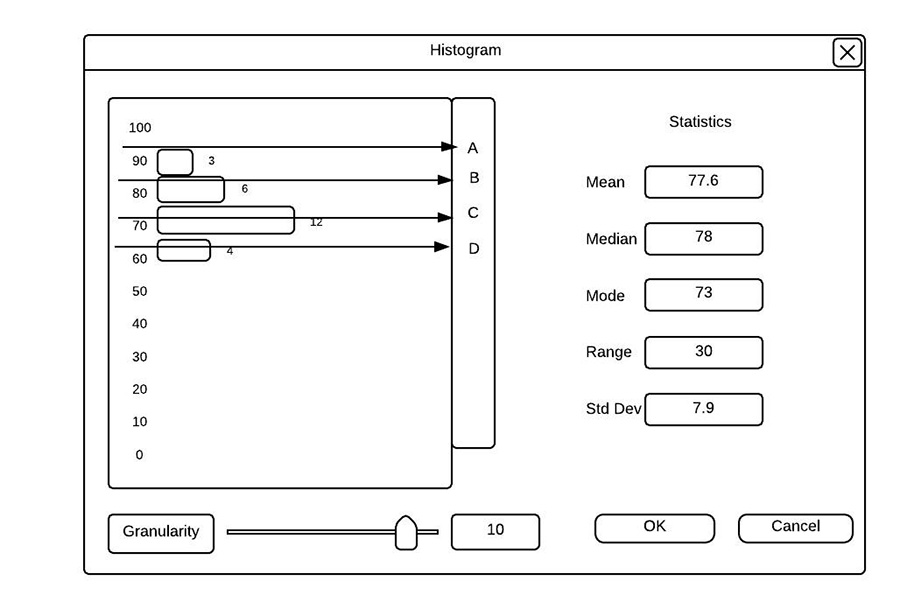
Populated Histogram View.
Note: For the interaction with the graphs and how it interacts with the gradebook, refer to Section 2.7.