2.1. User Interface Overview
The initial display consists of an empty gradebook. A tool bar allows a user (instructor) to do various things like create a class, create an assignment, use curve tools, view grade reports(student) and grade prediction(student).
When the user initially invokes the Grader tool, the screen appears as shown
in Figure 2.1.1.

Figure 2.1.1: Initial screen.
After the instructor adds a class and the required information then the Gradebook looks like figure 2.1.2. Statistics are displayed at the bottom of each assignment column. The instructor can sort students by any of the column categories. The instructor can change classes by clicking on the left column of classes.
The instructor can click on the visual tab to see graphs and to visually modify grades and grading schemes.
Students can click on the prediction tab to predict grades based on expected scores or ask for what scores they would need in particular assignments to reach a certain grade.
Students and instructors can click on the reports tab to obtain grading information.
Instructors can click on the assignment tab to see all assignments for a certain class or to create new assignments.
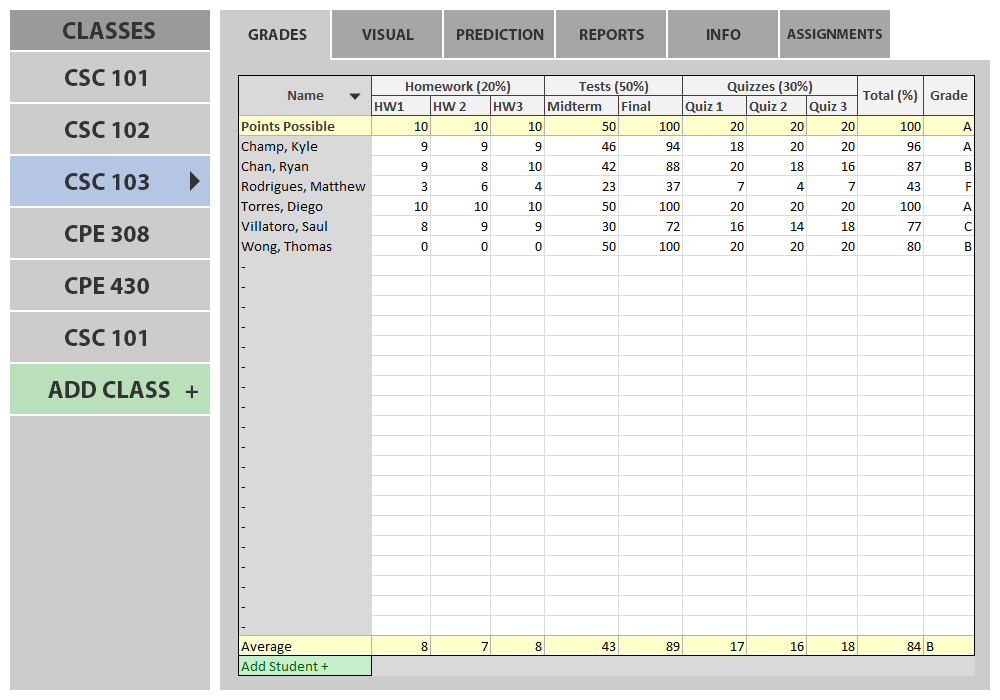
Figure 2.1.2: Gradebook Example.
Prev: [none]
| Next: Add a Class
| Up: Functional Requirements
| Top: index