2.5.1. Using the "Curve Tools" General Page
This screen shows the "General" "Curve Tools" page. This is the first screen that appears when the "Curve Tools" menu page is selected.
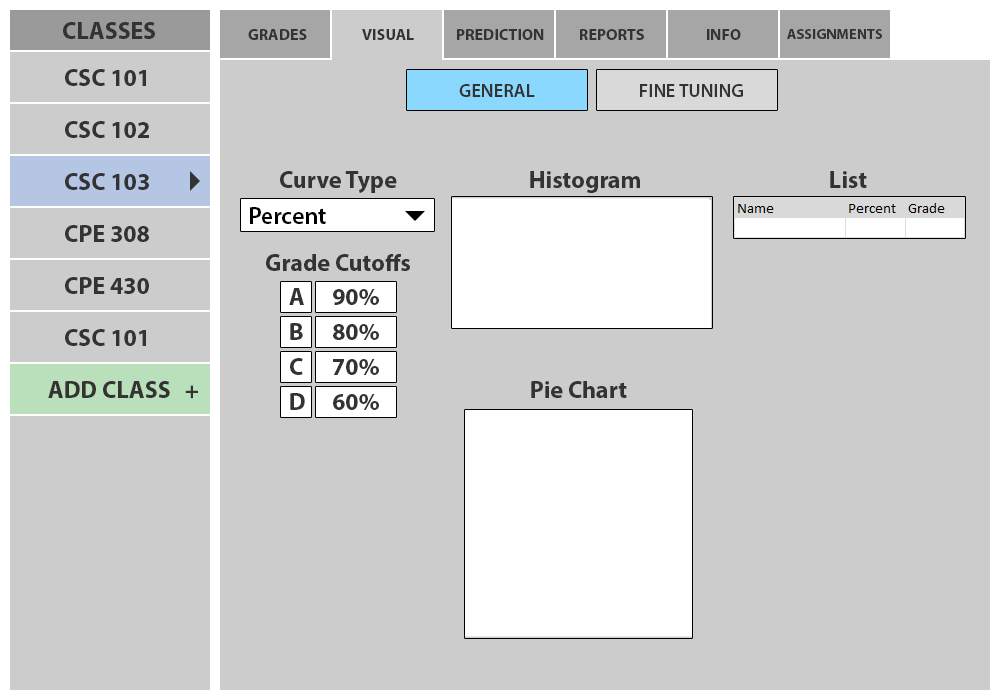
Figure 2.5.1.1: General Visuals with Empty Gradebook
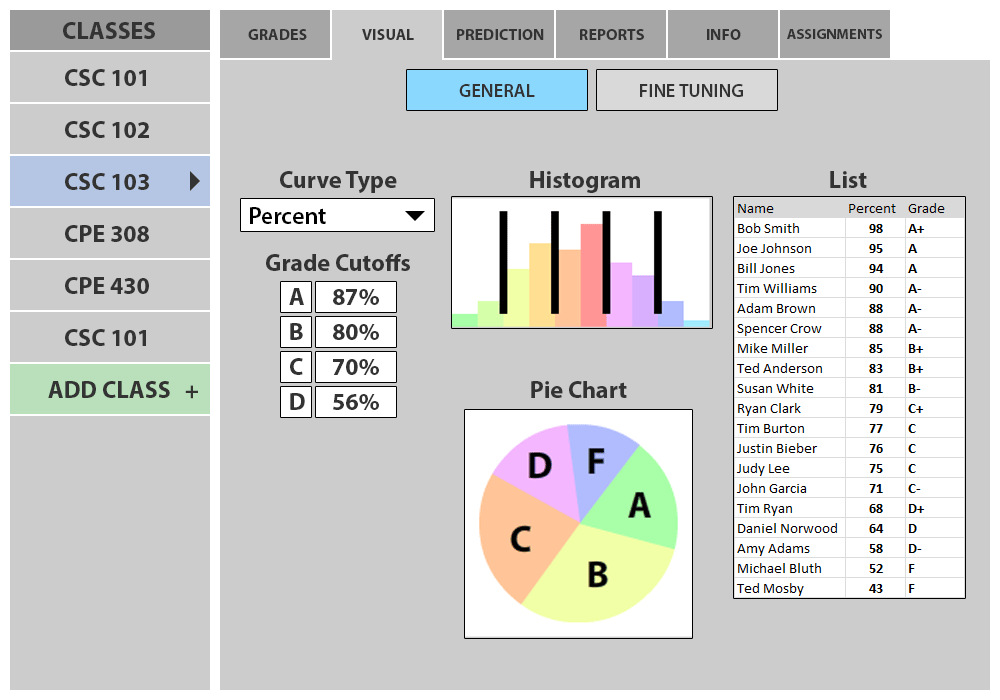
Figure 2.5.1.2: General Visuals with Nonempty Gradebook
Curve Type: When the user clicks the listbox, a number of options appear for the curve type. These options include Percentages and Points. When the user chooses a curve type the curve values on the rest of the page adapt to this.
Grade Cutoffs: The Grade Cutoff text boxes display the lowest possible score for that grade. These change to reflect changes on the histogram or pie chart, and when the user changes these values the rest of the page adjust to these changes. The text boxes are color coded based on user defined grade colors.
Histogram Button: If the user clicks on this button while the histogram is visible it hides the histogram. If the user clicks on this button while the histogram is not visible it becomes visible.
Histogram: The histogram displays the distribution of grades and the cutoff for each letter grade. If the user drags the black bars (cutoffs), the value of the minimum grade will change accordingly on the rest of the page. If for example the A cutoff is dragged past the B cutoff, the B cutoff will adjust to remain lower than the A cutoff. The sections of the histogram are colored based on user defined grade colors.
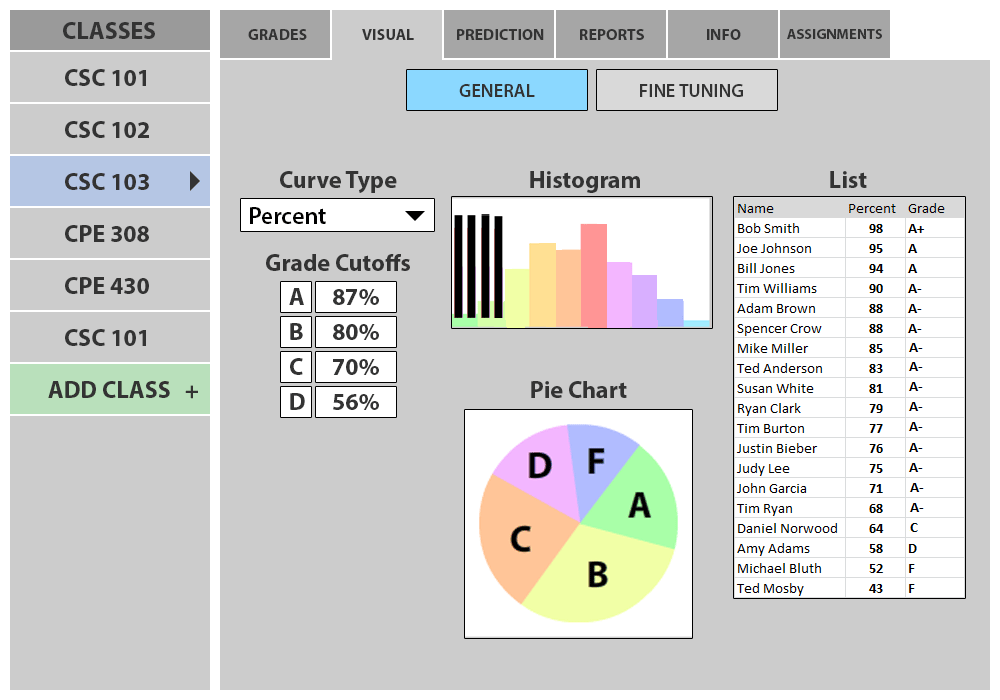
Figure 2.5.1.3: General Visuals after A Cutoff is Moved
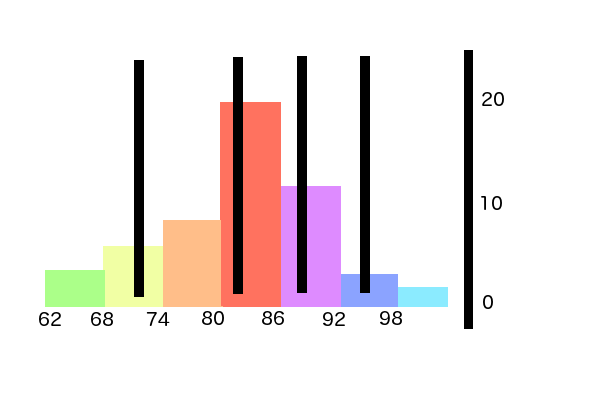
Figure 2.5.1.4: Zoomed in View of Histogram
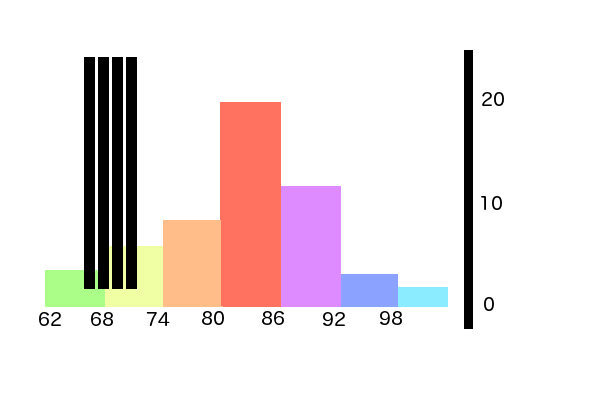
Figure 2.5.1.5: Zoomed in View of Histogram after A Cutoff is Moved
General Piechart
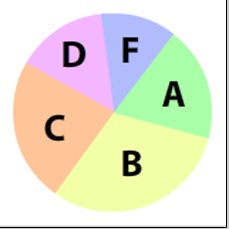
Pie Chart Button: If the user clicks on this button while the pie chart is visible it hides the pie chart. If the user clicks on this button while the pie chart is not visible it becomes visible.
Pie Chart: The pie chart displays the distribution of grades and the cutoff for each letter grade. If the user drags the black bars (cutoffs), the value of the minimum grade will change accordingly on the rest of the page. Like the histogram, cutoffs will adjust to ensure the cutoff values are valid. The sections of the pie chart are colored based on user defined grade colors.
Grades: Grades are shown on the right hand side of the page purely as a representation of the curve's effect on the class' grades. Rows will highlight in the appropriate colors to represent grades and Grades will change as the curve is adjusted by the user. There is no interaction for the user on this part of the page. It serves entirely as a visual representation.
Fine Tuning: Clicking on the fine tuning tab takes you to the Curve Tools Fine Tuning page.
Prev: [none]
| Next: Fine Curve Tools
| Up: Curve Tools
| Top: index