2.5.1 Changing the Grade Curve Using the Histogram
This scenario will show the user how to use the histogram. The
histogram is a chart that shows all the possible grades and percents,
and using astricks tells the user how many students received that
grade. If there is only 1 astrick only one student received that grade.
If there is 0 then no one received it. The histogram shows instructors
and students how many students are receiving each grade. It also allows
for easy adjustment of the grading scheme.
The grading curve can be manipulated very easily. First the user must
set the Grading Threshold. An example of a grading
scheme already setup is displayed below in Figure 2.5.1.1.
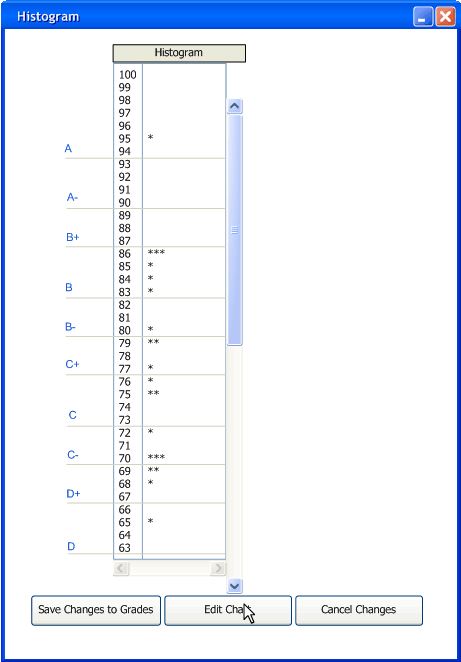
Figure 2.5.1.1
After setting what kind of
grades the class will receive the viewer needs to focus their attention
the actual histogram. The user then must decide if they want to change
part of the grading scheme. After deciding what grade the user wants to
change, the user must select the edit chart button on the bottom of the
screen. The grade lines on the histogram will change to become
editable.
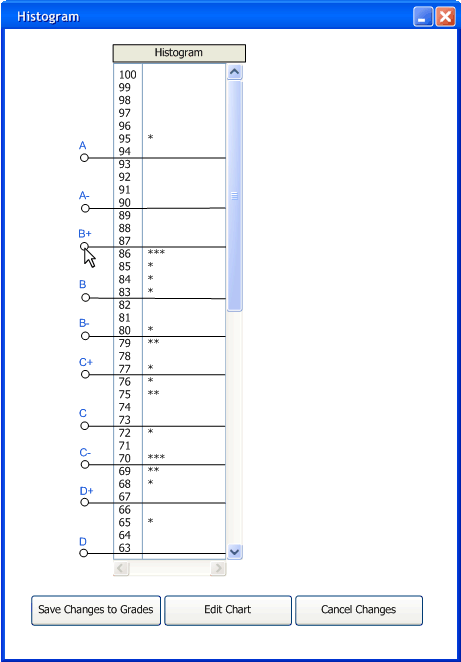
Figure 2.5.1.2
Figure 2.5.1.2 shows this
change of the lines. To increase the value of the grade the user must
move the line higher on the histogram. This will decrease the number of
people who will receive the grade. To lower the grade's value the user
must do the opposite by lowering the gradeline. The maximum of the
grade is determined by the minimum of the grade above it. For example,
if the user set an A-‘s gradeline to 90 and the A’s gradeline to 93%
anyone that receives a 90%, 91%, or 92% percent will receive an A-. It
is not possible to decrease the gradeline lower then the gradeline of
the grade below it. Same goes for increasing the gradeline. The user
can not make an A-‘s gradeline be 95 percent if A’s gradeline is 93%.
After changing the gradelines the user must press the save changes to
make the changes permanent and have the changes affect the main
spreadsheet, and grading threshold.
The professor can also prevent a student from recieving a certain
grade. For instance if a professor didnt want any students to recieve a
D he could make them all receive a C. To begin, the professor must drag
the C gradeline down till it ran into the C- gradeline. The gradeline
can not go lower then the gradeline below it. If the user attempts to
lower the gradeline lower it will just snap to the gradeline just below
it. Figure 2.5.1.3 below shows the user dragging the C gradeline onto the C-
gradeline.
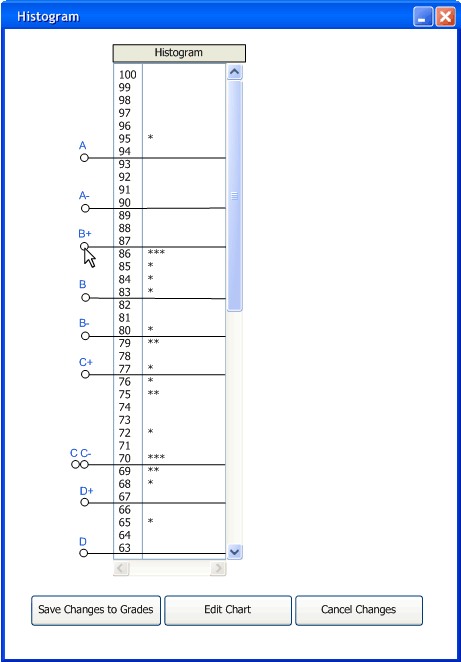
Figure 2.5.1.3
The professor must then move both the C- and the C gradelines to the D+
gradeline. To do this easily the user just grabs the highest grade out
of the stacked gradeline and drags it down. Or visa versa for
increasing both gradelines. Figure 2.5.1.4 shows all three gradelines
stacked on top of each other.
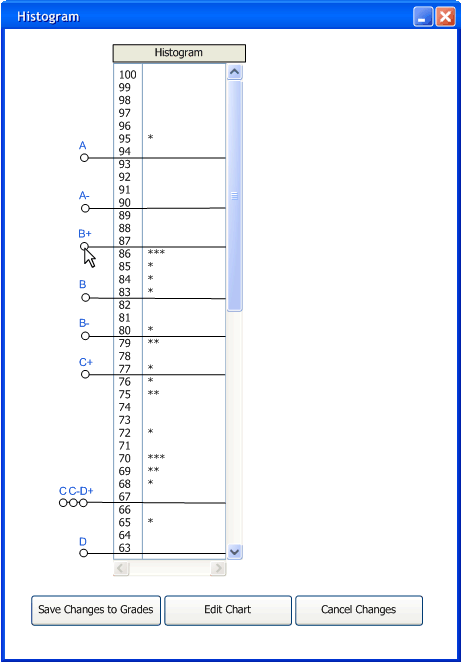
Figure 2.5.1.4
The professor then moves the C gradeline down to the D
gradeline. This will drag the C-, and the D+ gradeline with the C
gradeline. This will stack all four gradelines on top of each other and
make the students previously reciving a D grade have a C grade.
When the save changes button is pressed it updates both the gradesheet and the PieChart as well as the Histogram. Below in Figure 2.5.1.5 shows all three updated.
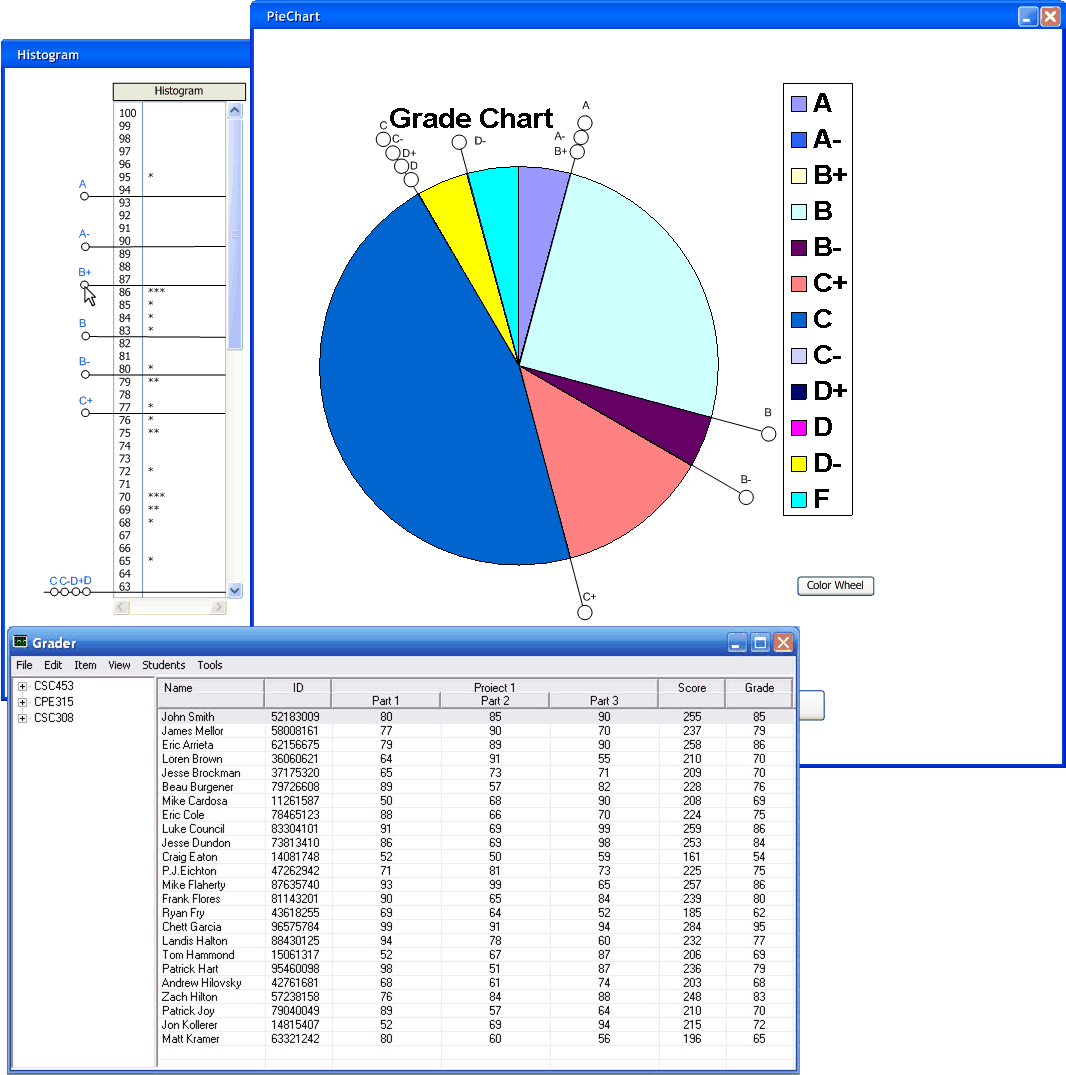
Figure 2.5.1.5
Prev: None |
Next: Changing
the grade curve using a pie chart | Up: Graphs | Top: index


