2.6 Scaling
Grades
This scenario demonstrates the graphic grade scaling functionality of the
Grader tool. Using the Grader tool, the
instructor is able to use graphs to scale the grade distribution of the class.
This functionality helps the instructor to have a visual understanding of what
the grade break down is and the ability to easily make changes directly on the
graphs until the grade distribution is to his liking. It also allows for students to predict their
grades by predicting the grade breakdown.
The grade scale functionality has three modes of operation: the pie chart,
the histogram, and the data table. The
user can choose to use only one or all modes of operations at the same time. Whatever changes are made in one mode will be
reflected on the other modes as well.
Figure 2.6-1
Standard Grade Scale
Figure 2.6-2
Grade Scale With +/- Grading System
Each grade is assigned a color to give better indication of the grade breakdown. The user can change the color of each grade
by changing its properties as shown in Figure 2.6-3.
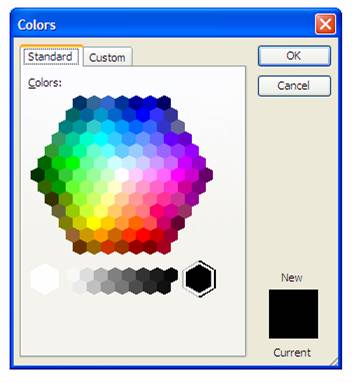
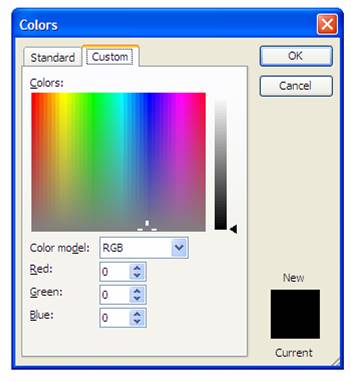
Figure
2.6-3 Color palettes
Figure 2.6-4 shows the original graphs
with the B section’s color changed to purple.

Figure
2.6-4 Graphs with altered color.
The default grade distribution of any given class is as follows:
A: 100%~90%
B: 89%~80%
C: 79%~70%
D: 69%~60%
F: 59%~0%
Prev: Adding, Editing, and Deleting | Next: Piechart | Up: Functional
Requirements | Top: index