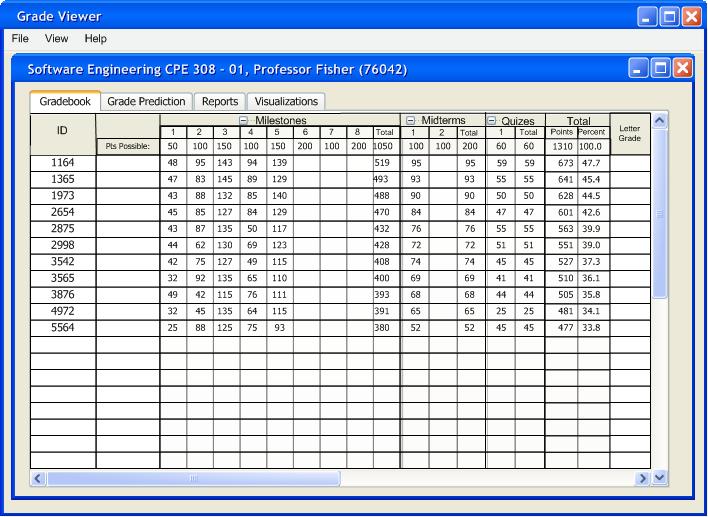
Figure 2.8.1: Grade Viewer: Initial Grade File Opening
The Grade Viewer offers students a way to predict their final point total by inputting integer scores under any graded item. Students are also able to edit their final point and percentage totals and have the grader predict average scores they must obtain to achieve their desired final point total, details given later on.
To predict grades a user retrieves his/her grade file from the instructor and opens it in the Grade Viewer. A screen similar to Figure 2.8.1 appears after opening the grade file.
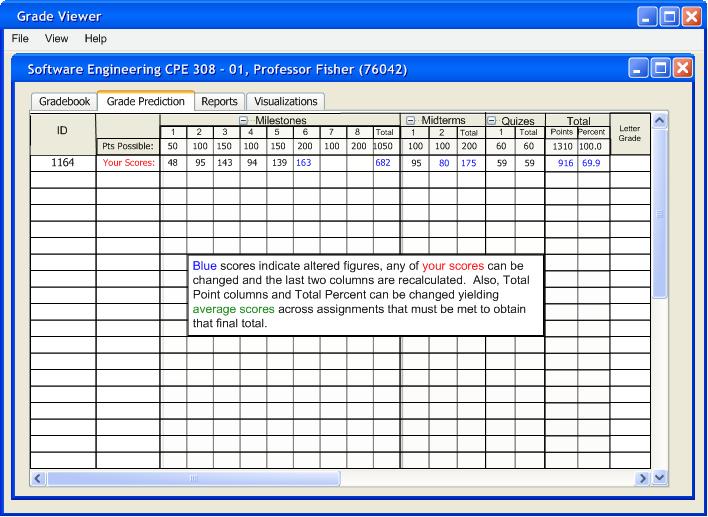
Under the gradebook tab the user can observe students' scores relative to their peers. By clicking the Grade Prediction tab the user is taken to a forecasting mode where only their grades are shown in a single row. The user can type an integer, ranging from 0 to "Points Possible", in any cell underneath a Graded Item column. The "Total Points" and "Raw Total %" cells will automatically adjust to reflect the point modifications to the grade sheet. Any score appearing in blue has been altered from the student's scores recorded by the teacher, refer to Figure 2.8.1. Figure 2.8.2 shows the user has filled in his/her "Midterm 2" score (80) to predict his/her final grade.

The Total Points and Total % columns have adjusted to reflect this change. Totals Points becomes 753 and Total % changes to 57.4%. In Figure 2.8.3 the user has inputted a score for their Milestone 6 assignment (163). Again, the total points and percentage columns on the far right adjust.
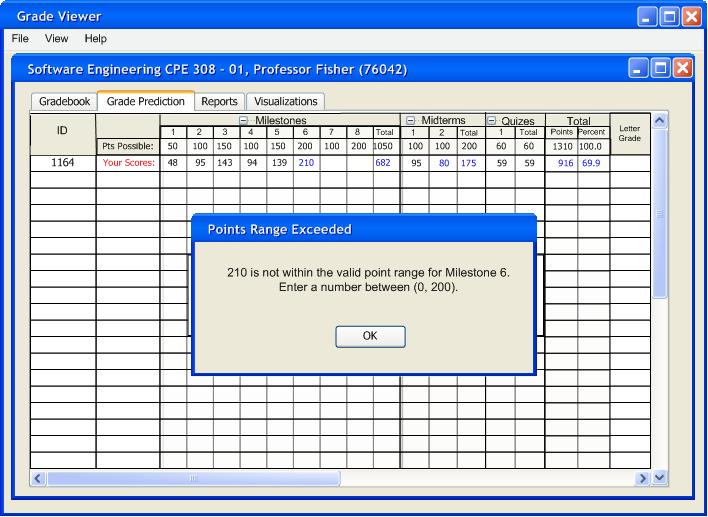
If the user attempted to fill in the Milestone 6 points with 210 the system would respond with a points out of range error. Figure 2.8.4 below depicts this situation.
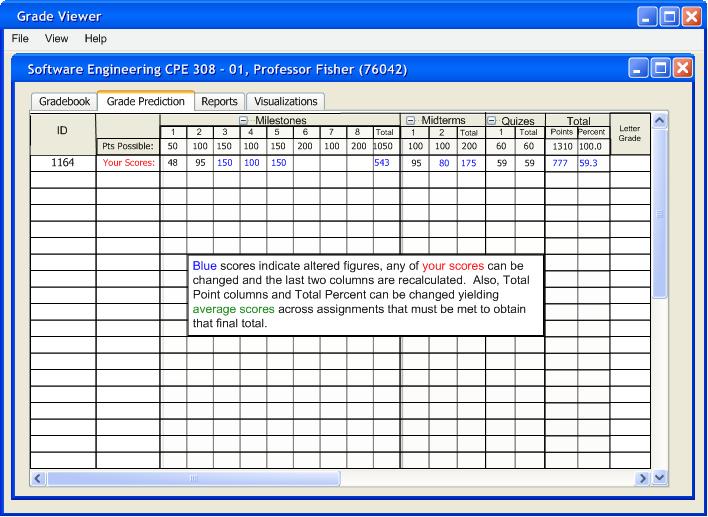
In the Figure 2.8.5 below Milestones 3-5 have been filled in to predict the grade the student could have received with perfect scores in these assignments.
In the next figure the user has changed the total number of points (950) under the Milestone Graded Item. This type of prediction has two effects. Identical to the previous predictions described for figures 2 through 4 the final totals are adjusted, in addition average scores are given in the empty Milestone cells that must be achieved to obtain the desired score of 950. The average scores are displayed in green. Figure 2.8.6 illustrates the averaging across the Milestone Graded Item.

The averaging over assignments works as follows: First, the user must enter a desired final figure for a Total Points column or a Final Total % for their overall grade. The new total number of points is subtracted from the the total number of points pre-prediction. In the above case involving the Milestones 519 is subtracted from 950 giving 431 points. These 431 points are the amount needed for the student to obtain his/her desired Milestone point total of 950 given the 519 they have already earned. In this case Milestones 6 through 8 are still outstanding (500 points), each needs to fulfill a chunk of the 431 points. The chunk sizes are determined by dividing the points possible for each Graded Item by the total outstanding points remaining (500 in this case). Milestone 6 needs to account for 40% of the 431 points needed to achieve a total of 950 points under the Milestones. Similarily, Milestone 7 needs 20% and Milestone 8 needs 40% of the 431 points. This is the procedure for calculating the average scores in green.