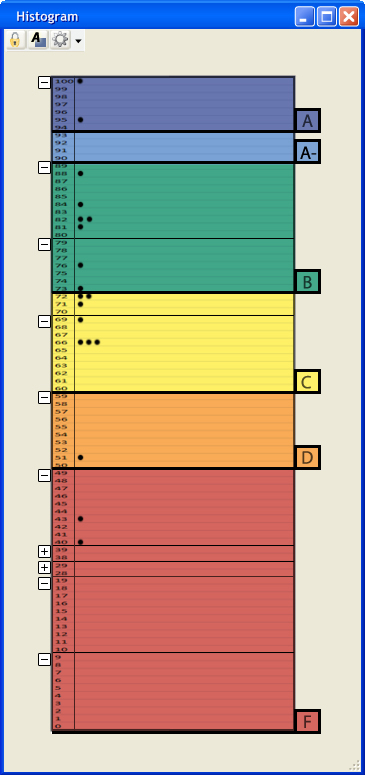
The data from the spreadsheet populates the histogram, and the user can adjust the curve on the histogram. When the user first opens the histogram window through the main menu (Window -> Histogram), Figure 2.6.1.1 appears.
Figure 2.6.1.1: Filled Histogram (Dot Graph)
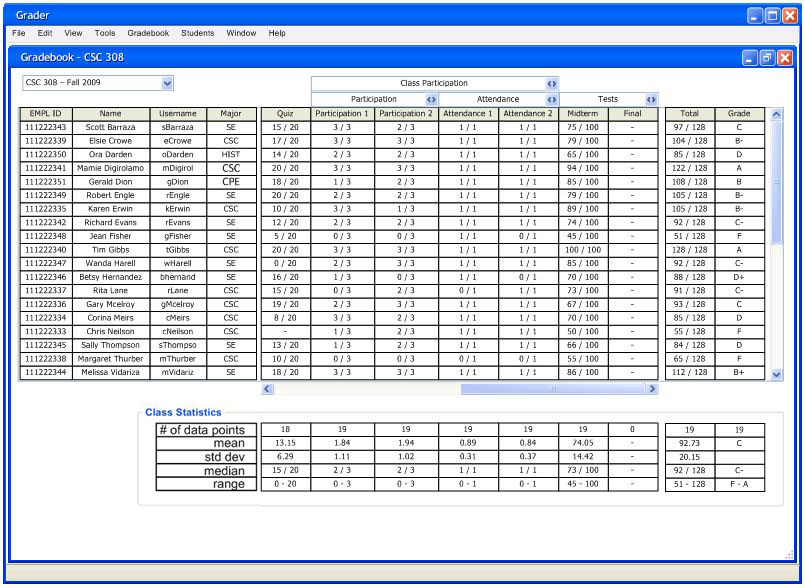
Figure 2.6.1.2: Gradebook Initial Data
Figure 2.6.1.1 above presents a histogram populated with the data in Figure 2.6.1.2 above and with the default options (Figure 2.6.2.7). The colors on the histogram match the colors on the Grading Scheme. When the user moves a certain grade tab up or down a number of lines the grading curves change to reflect the newly selected range of percentages for that certain grade. Whenever the histogram changes the grading curves, the pie chart and the grading scheme follow suit, and when the pie chart or grading scheme adjusts the grading curves, the histogram's grade tabs change position to reflect the new grading curves. Additionally, the user removes some tabs.
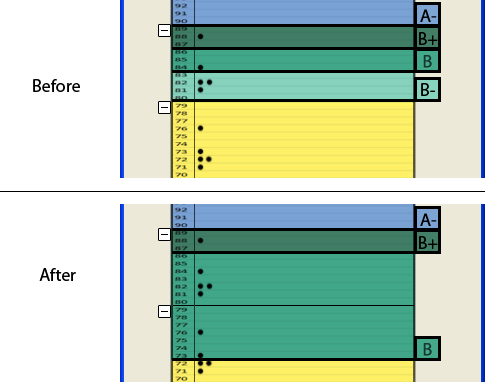
Figure 2.6.1.3: Moving and Overtaking a Tab
The above Figure 2.6.1.3 shows an example of when the user moves a tab. If the user moves one grade tab over another, the current moving tab will overtake the one covered. For example, if the user drags the 'B' tab all the way down to 73 percent, the 'B-' no longer shows up, and all the percentages from 86 to 73 turn into 'B's. If the user wants to add an overtaken grade tab back in, the user right-clicks on the nearest grade tab and selects Add a Tab. The grading scheme window pops up, and the user checks the desired grade and sets a percentage range. After, the histogram will add in the new tab and adjust the curves to match the grading scheme curves.
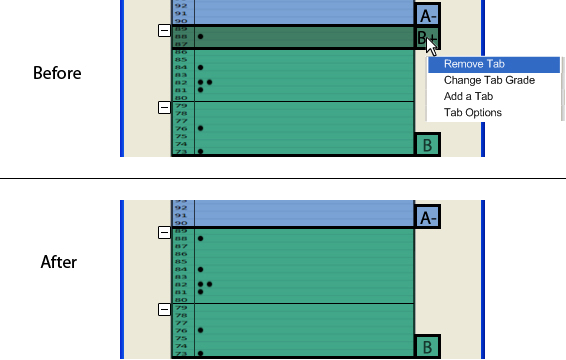
Figure 2.6.1.4: Removing a Tab
The above image (Figure 2.6.1.4 shows how the user removes a tab. The user right-clicks on a tab and selects Remove Tab. The user can also change the grade of the tab and access the Tab Options section of the Histogram Options (discussed later) by right-clicking on a tab. The image below (Figure 2.6.1.5) shows a scenario in which the tabs overlap. If the user does not like the overlapping tabs, the user goes into the histogram options and changes the tab size to the height of one row (discussed more in detail later).
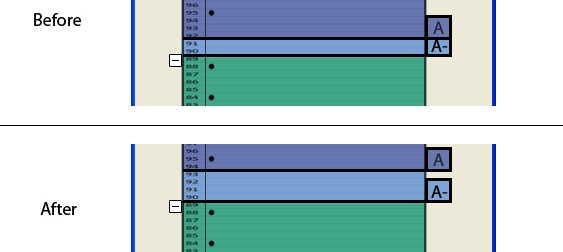
Figure 2.6.1.5: Overlapping Tabs
The toolbar on the top left corner has buttons for Lock/Unlock, Grade Scheme window, and Options window. Figure 2.6.1.6 below shows a close up of the toolbar that both the pie chart and histogram use.
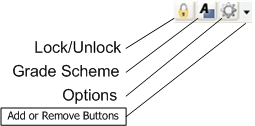
Figure 2.6.1.6: Graph Toolbar
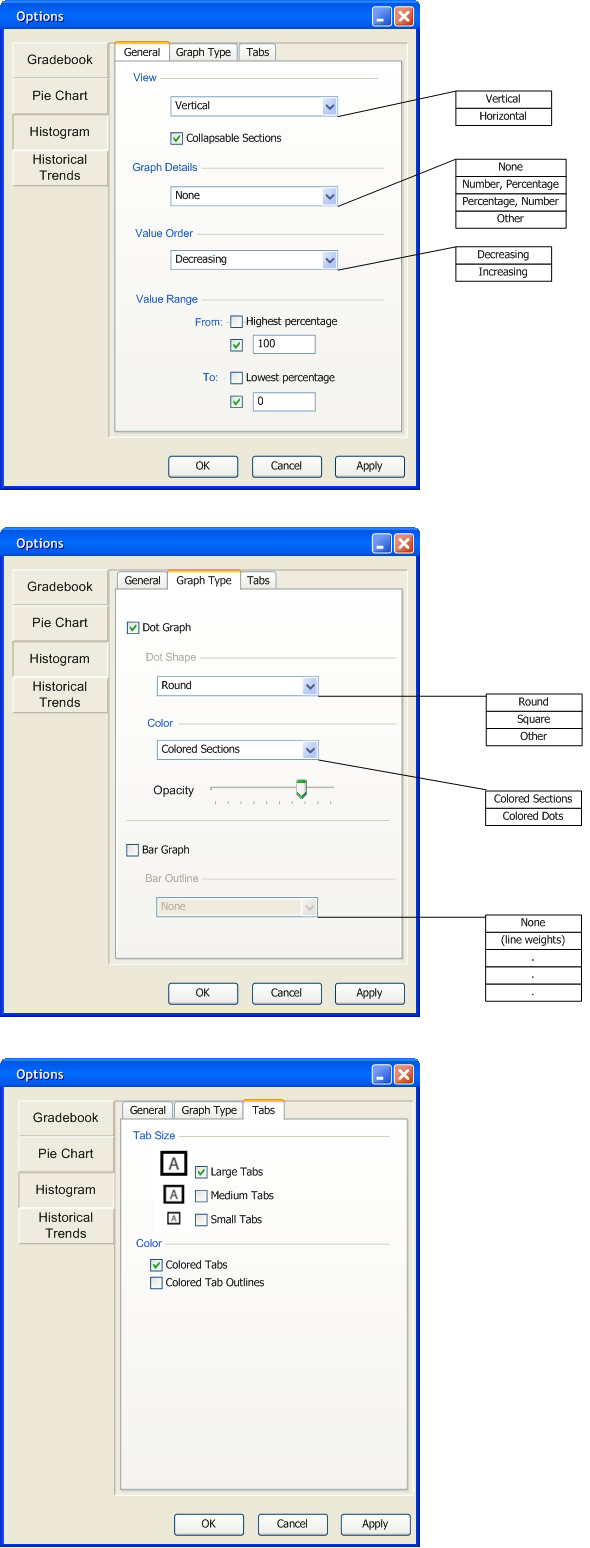
Figure 2.6.1.7: Histogram Default Options Window
   Format:   (with numStudents = 62 and percentStudents = 100 <- values given by grader)
      (1)   numStudents + ", " + percentStudents + "%"
      (2)   numStudents + " students, " + percentStudents + "%"
      (3)   "students: " + numStudents + ", " + percent students + "%"
   Graph View:
      (1)   62, 100%
      (2)   62 students, 100%
      (3)   students: 62, 100%

Figure 2.6.1.8: Graph Details Other Window
Value Order gives the user the choice of decreasing or increasing percentages on the histogram. The Value Range allows the user to decide what percentage values will appear on the histogram. The highest and lowest percentages represent the highest and lowest grades from the data respectively.
The Graph Type tab allows the user to choose between a Dot Graph or a Bar Graph. After the user chooses a graph type, that graph's options activate and allow the user to customize the graph. The Other option in the Dot Shape section allows the user to choose a shape from outside images. Figure 2.6.1.9 below pops up when the user wants to import a shape from file.
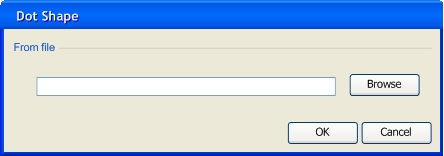
Figure 2.6.1.9: Dot Shape Other Window"
In the Color section, the user has the choice of colored sections or colored dots. The Opacity slider allows the user to choose the opacity of the colored sections or colored dots. The histogram options set the default opacity to 75% for colored sections and 100% for colored dots. The bar graph options offers the user choices of bar outlines. The user changes the grade tab sizes in the Tabs tab. Tabs offers 3 sizes: the height of 3 rows, the height of 2 rows, and the height of 1 row. The user also changes the tab coloring options here. Colored Tabs color the inside of a tab, and Colored Tab Outlines colors the outline of a tab.
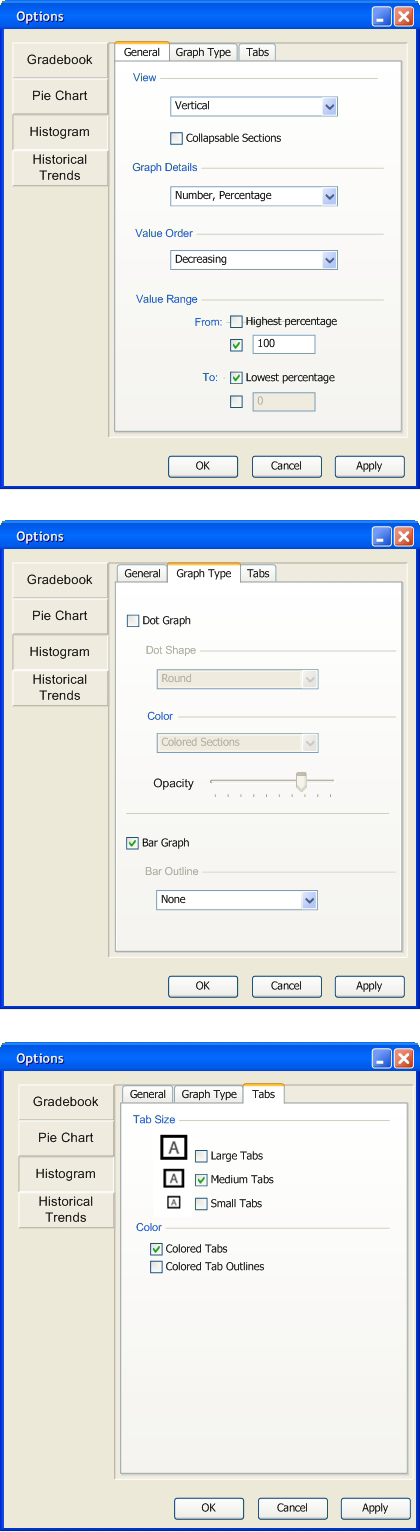
Figure 2.6.1.10: Filled Histogram Options
The picture above (Figure 2.6.1.10) shows the Histogram Options with some sample options chosen, and the image to the left on Figure 2.6.1.11 (vertical graph) below refects those chosen options. The image to the right on Figure 2.6.1.11 (horizontal graph) shows what the graph looks like when the user chooses the horizontal view.
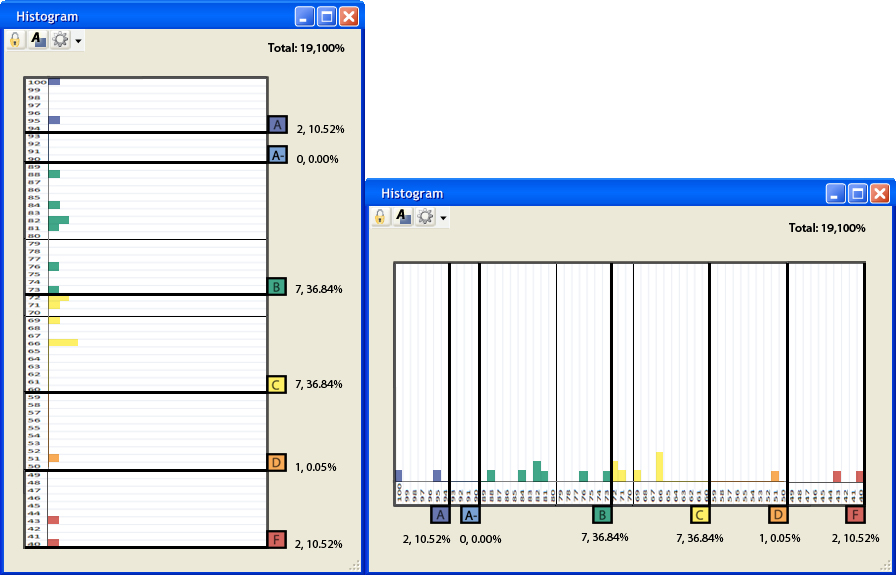
Figure 2.6.1.11 Filled Histogram (Vertical and Horizontal Bar Graphs)
After the user makes all the above changes, the gradebook adjusts its data to the histogram's grade curving changes. The image below (Figure 2.6.1.12) shows what the gradebook looks like after these adjustments.
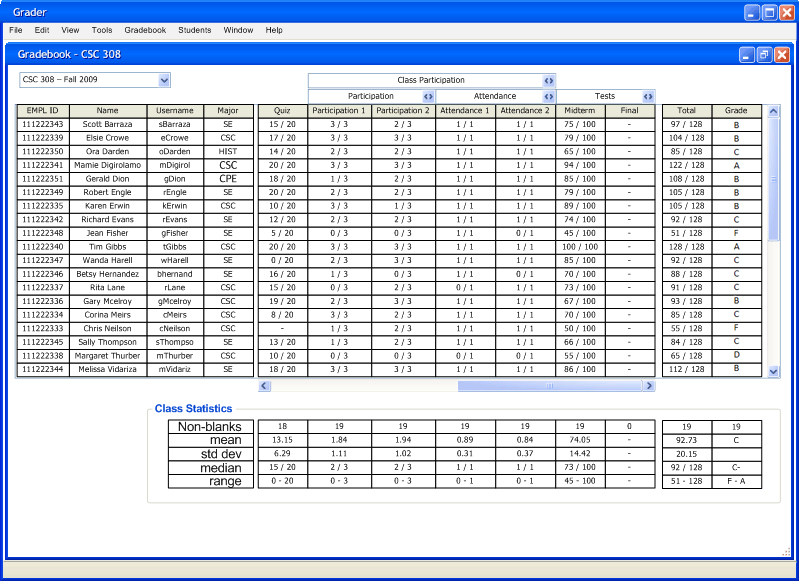
Figure 2.6.1.12: Gradebook Resulting Data