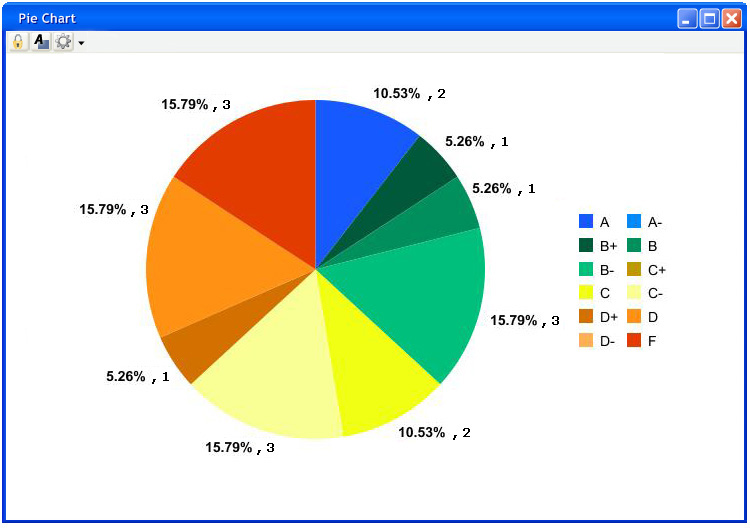
The Pie Chart graphically views data from the Gradebook's spreadsheet. It views any category
or subcategory of data in the Gradebook. When the user selects to view a pie chart,
the Grader displays the pie chart window, which you see in figure 2.6.2.1.
Figure 2.6.2.1: Default Pie Chart Window.
The window has three toolbar icons, Lock/Unlock, Grade Scheme and Options.
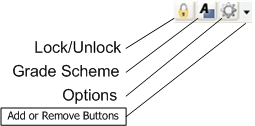
Figure 2.6.2.2: Pie Chart Toolbar
The Lock/Unlock menu has the option to lock or unlock the option to modify the pie chart. The pie chart defaults to locked. However, when the unlock toggle is on, the user uses the cursor and clicks on a line in the pie chart, then drags in a direction to modify the curve. When dragging the line, only two grade values change, the ones next to the dragging line. Whenever the pie chart changes the grading curves, the histogram and grading scheme change as well. As you see in Figure 2, when dragging the line between B and B-,the value of B- adds to B.
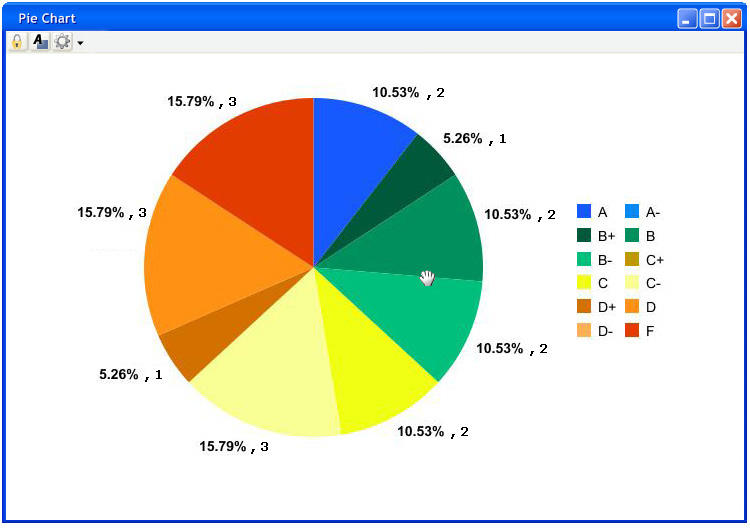
Figure 2.6.2.3: Modifying Curve via Pie Chart
If the user drags one line over another, the current moving line overtakes the ones covered. For example, if the user drags the B line to the C line, the B grade range inherits the grade range of B-. As the changes are made, the values next to the chart continually update as well as the grading scheme and histogram.
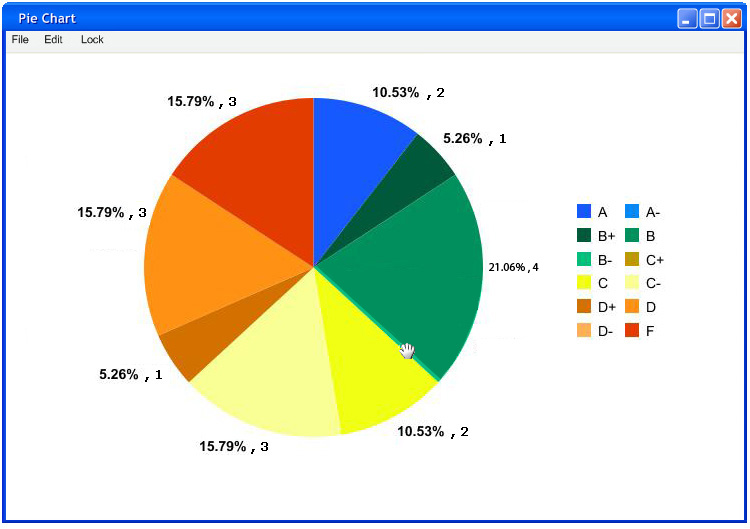
Figure 2.6.2.4: Dragging Grade Range Over Another Grade Range
The second toolbar icon is Grade Scheme, which brings up the option window to modify the grade scheme, grade ranges, and edit the colors for each grade range. Lastly is the Options icon which opens the Graph Options window which has graph specific options. The Pie Chart has the ability to change the display of values besides the pie chart, as well as combine +/- grade ranges to create a more simplistic pie chart with the Combine Like Grades check box.
Figure 2.6.2.5: Pie Chart Options Menu
Figure 2.6.2.5 is an example of a pie chart with the Combine Like Grades option on.
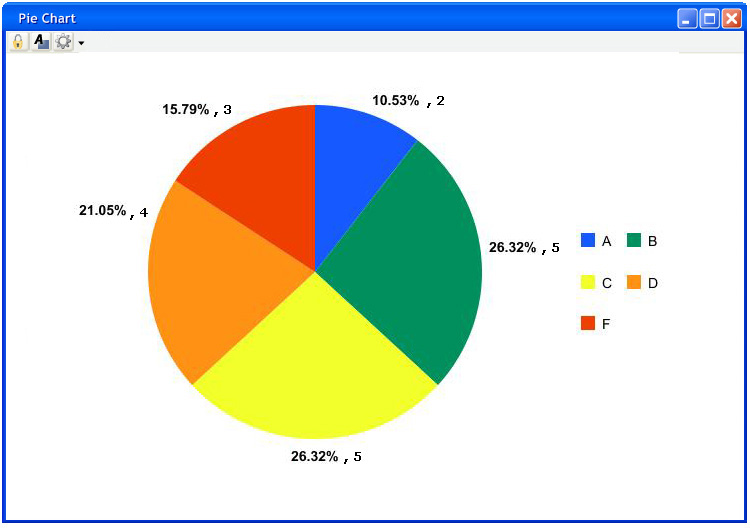
Figure 2.6.2.6: Combine Like Grades