The user clicks the 'Historical Trends' option under the 'Tools' file menu to access the historical trends feature. The Grader prompts the user to select a quarter and class section corresponding to the class they wish to view the historical trends of, as shown in Figure 2.6.3.1.
![]()
Figure 2.6.3.1: Select Class Dialog Box
The Grader automatically accesses the department server and finds all quarters with gradebooks or historical trend information corresponding to them, and places them into the 'Select Quarter' drop-down menu. Section 2.8.1 provides details of the server set up. The user selects from the list of quarters. The dialog box displays all previous classes corresponding to the selected quarter, as shown in Figure 2.6.3.2.
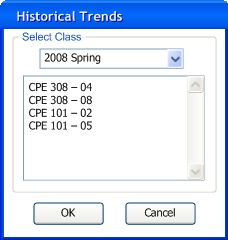
Figure 2.6.3.2: Select Class Dialog Box Filled
The user selects among the class sections listed and presses 'OK'. The Grader displays a window showing the statistics of the selected class in histogram form, as shown in Figure 2.6.3.3.
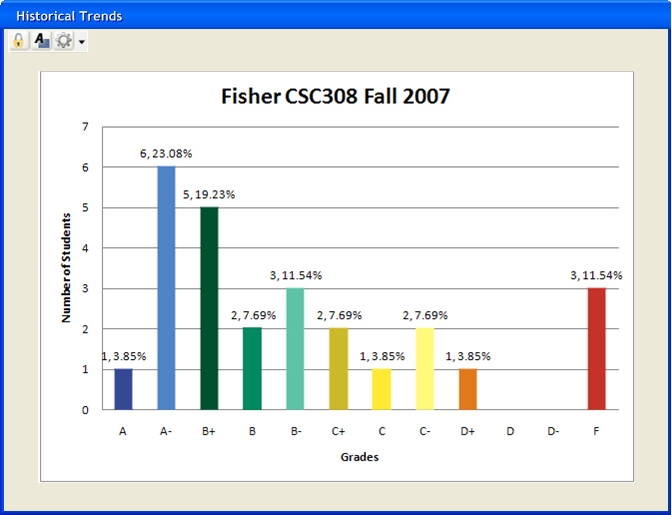
Figure 2.6.3.3: Historical Trends Window
The histogram defaults to seperating like-grades and displaying the number of students and percentages corresponding to each bar. The toolbar on the top left corner has buttons for Lock/Unlock, Grade Scheme window, and Options window. Figure 2.6.3.4 below shows a close up of the toolbar used.
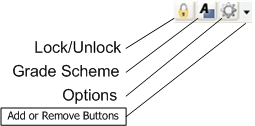
Figure 2.6.3.4: Historical Trends Toolbar
When the user clicks the Options button from the toolbar, the Grader tool presents the Historical Trends Options window, as shown in Figure 2.6.3.5.
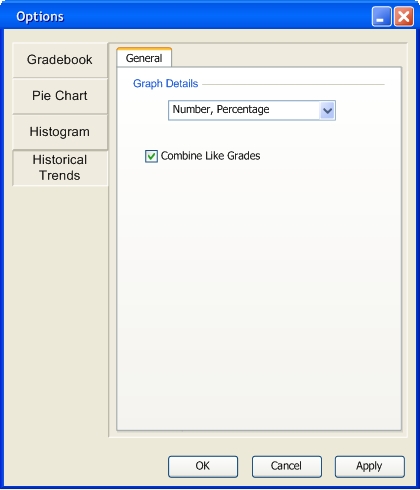
Figure 2.6.3.5: Historical Trends Options
Graph Details gives the user the choice of viewing extra information on the graph. The Number represents the number of students with each grade, and Percentage represents the percentage of students with that grade. The user can select which ones are displayed, and their order. Combine Like Grades allows the user to combine the '-' and '+' variations of the letter grades into a single histogram bar. Figure 2.6.3.6 shows the historical trends graph with like-grades combined.
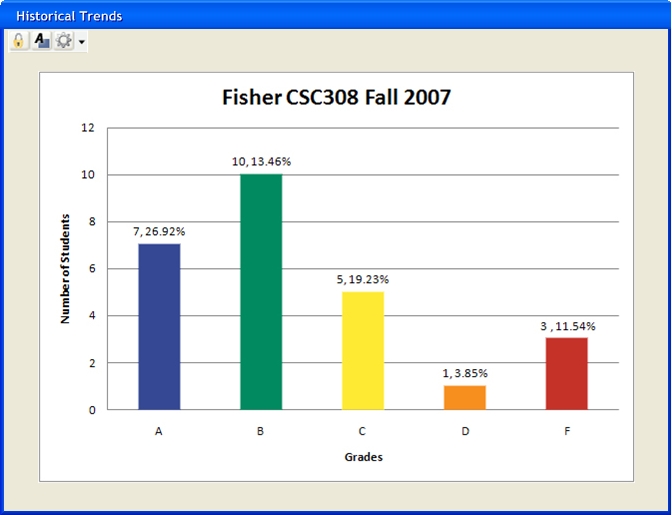
Figure 2.6.3.6: Historical Trends With Combined Like-Grades