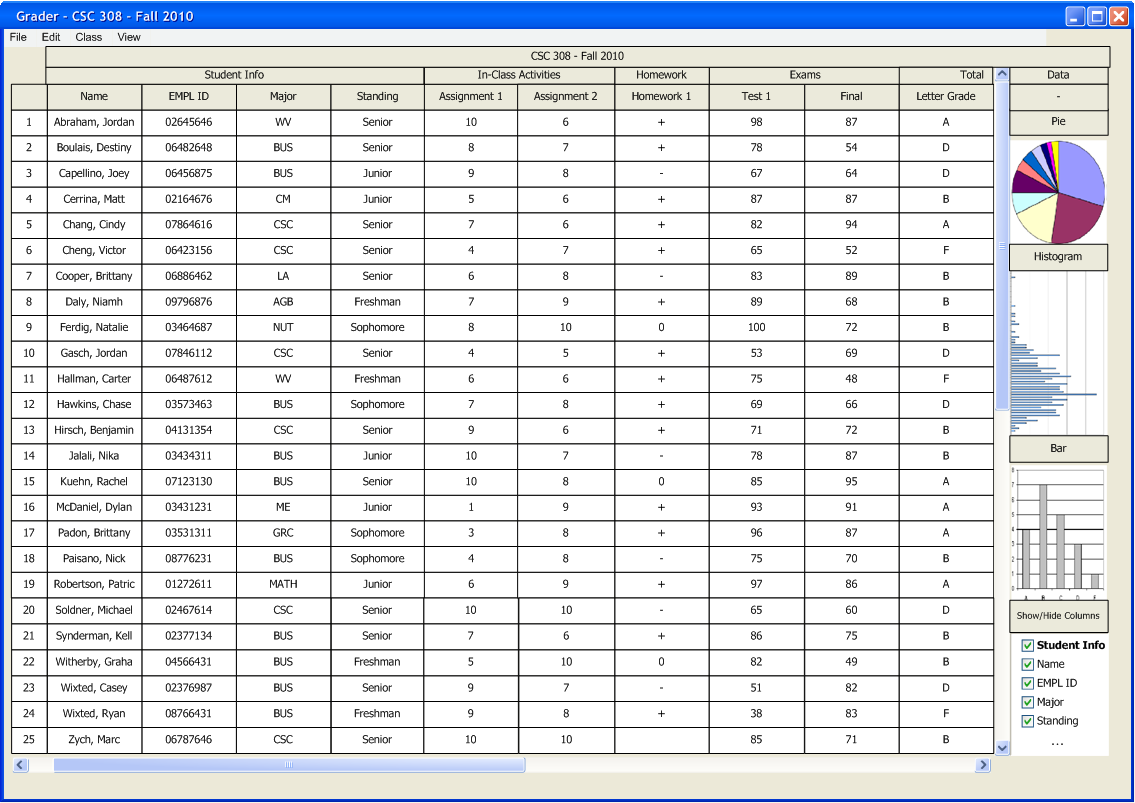
Figure 2.6.1a: Spreadsheet with sidebar active
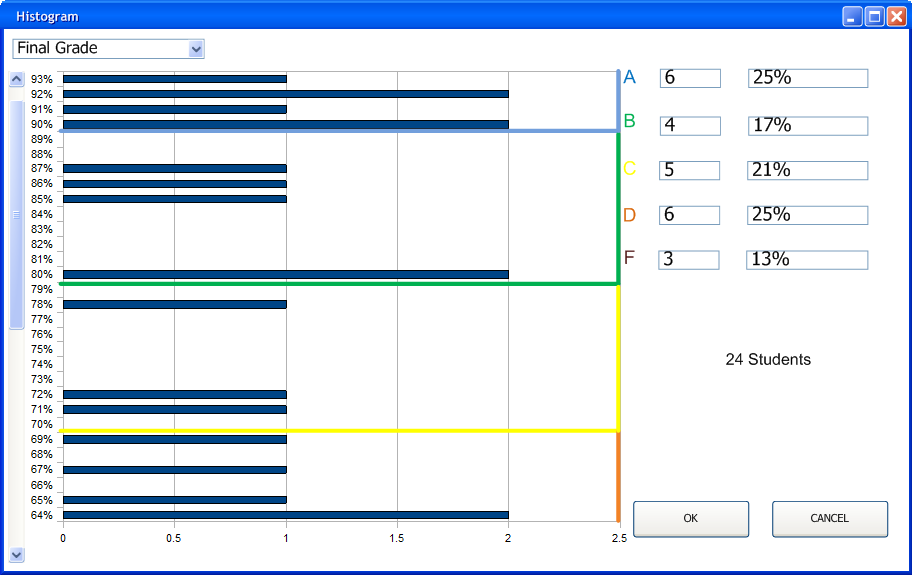
Figure 2.6.1b: Histogram Initial View
When the user hovers the mouse over a line additional information is shown. The color and location of the line are dependent on the final grade scheme.
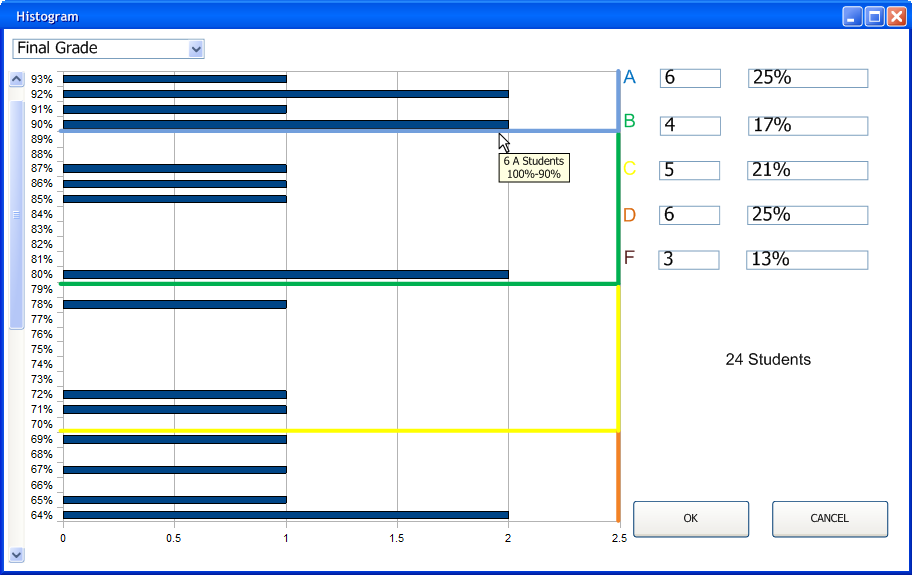
Figure 2.6.1c: User hovering over lines shows additional information.
Other assignments and categories are also viewable. The user selects the category or assignment from the drop down menu. Sub-categories are shown using arrows items without arrows are graded items. However, the user will not be able to modify the grade scheme for these items.
Figure 2.6.1d: Choosing display categories.
The grade scheme is also applied to these assignments, as shown in figure 2.6.1e.
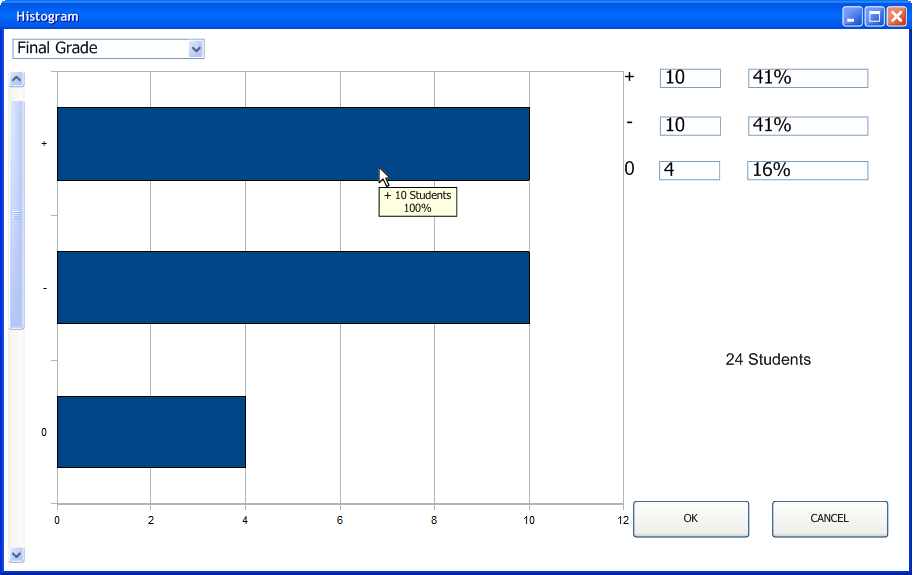
Figure 2.6.1e: Showing homework 1 grade scheme using the histogram.
When the user creates a new final grade scheme the histogram will update to display this. For example if the user creates a +/- final grade scheme it will be shown in the histogram.
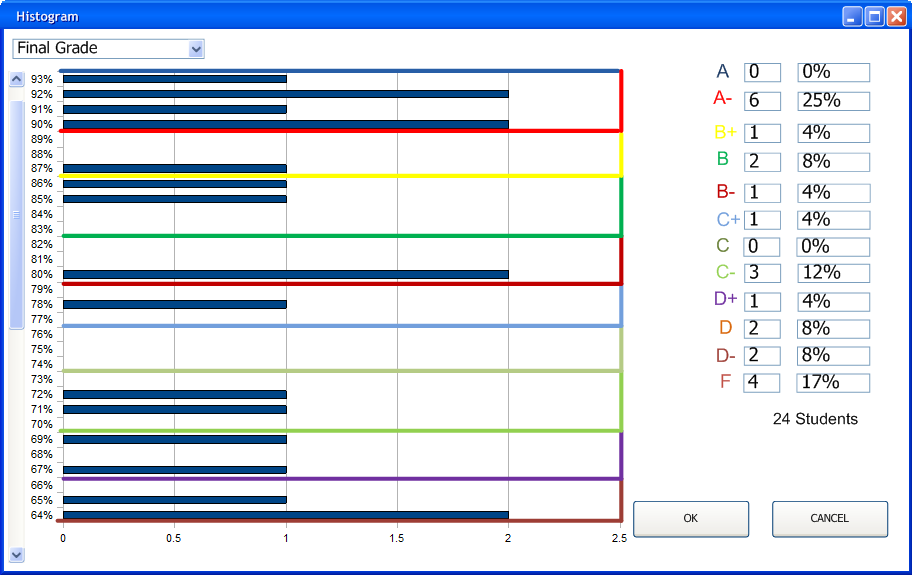
Figure 2.6.1f: Showing final grade scheme's effects on a histogram.
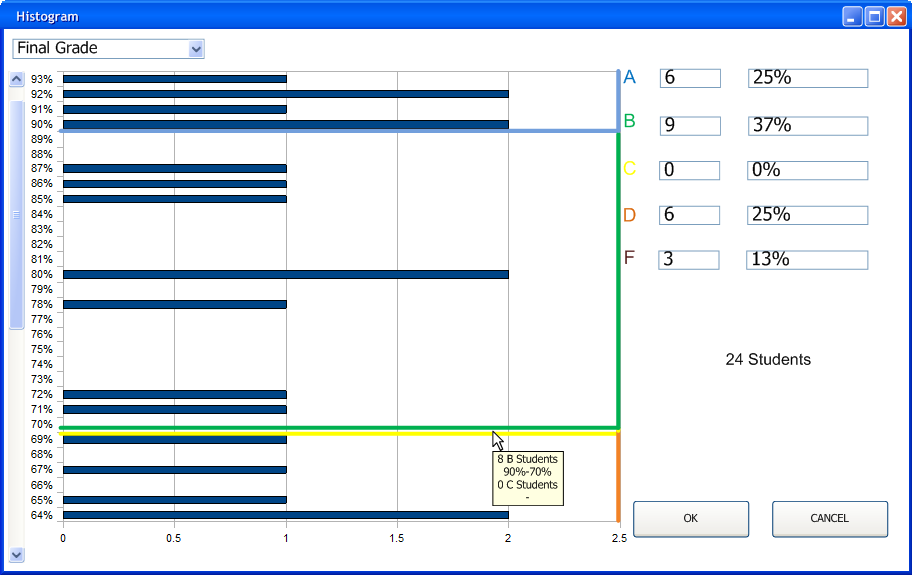
In this example of histogram manipulation a 5 letter grade scheme is shown for easy understanding. The user can alter the grade scheme by clicking and dragging the lines of appropriate color to the grade.
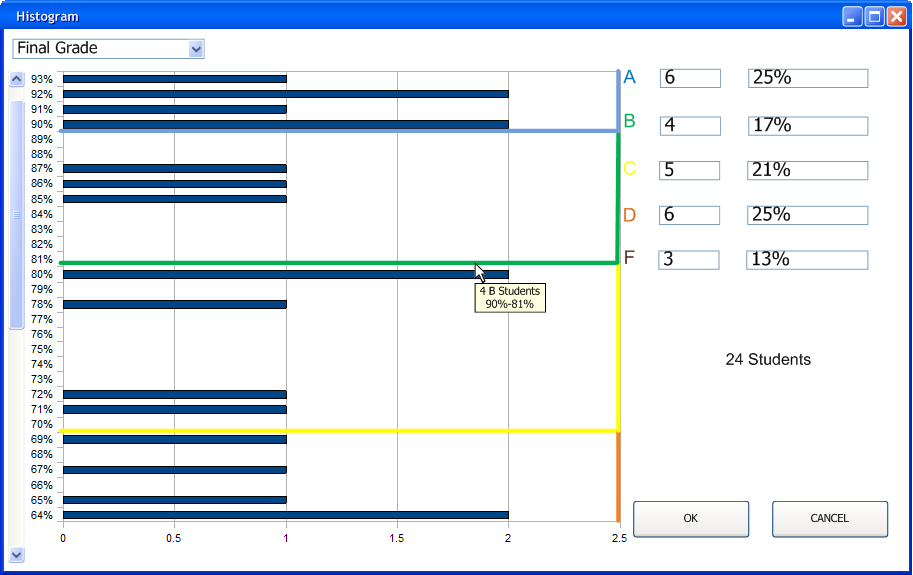
Figure 2.6.1g: User getting ready to move the bar.
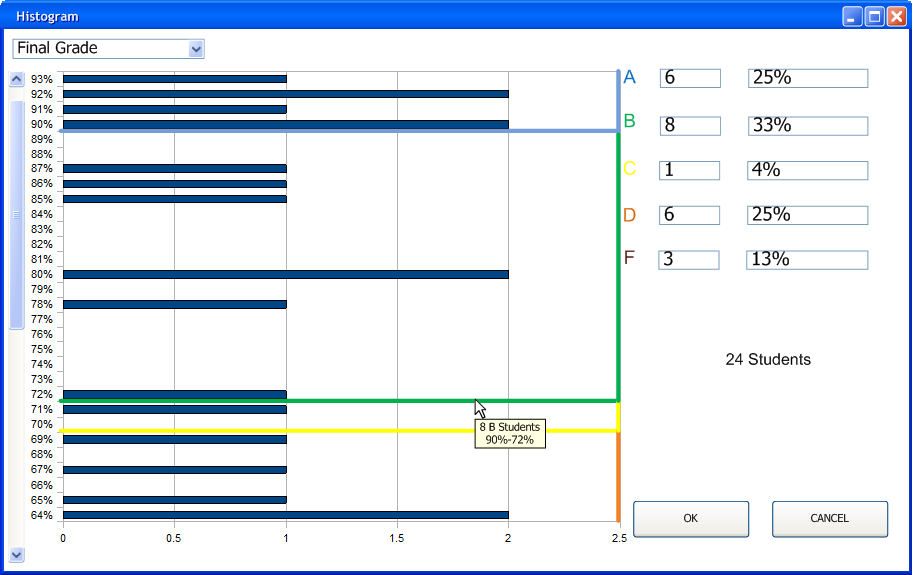
Figure 2.6.1h: User getting ready to moving the bar.
The user can also collapse a grade area of the histogram by dragging one grade area into another grade area.