When 'View Sidebar' is checked, a thumbnail of the pie chart will be shown on the right hand side of the screen. When the user double clicks the thumbnail, or clicks on 'Pie Chart' from the 'View' drop down menu, a pie chart dialog will be displayed on the screen. See figure 2.6.2a.

Figure 2.6.2a: Filled spreadsheet with active sidebar
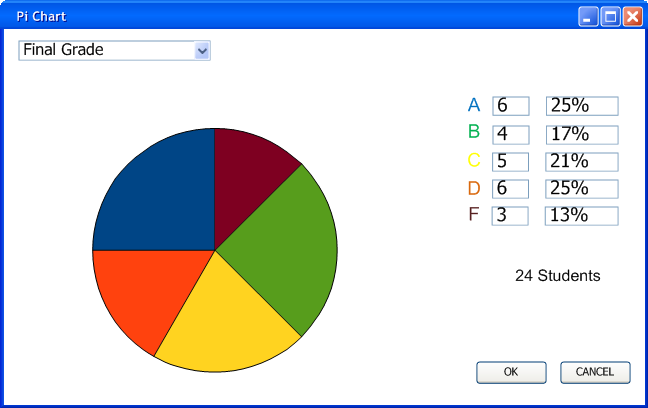
Figure 2.6.2b: Initial Pie Chart UI
When the user hovers the mouse over a portion of the pie chart additional information is shown. The color of the slices and how large the portion of the pie is is dependent on the final grade scheme.
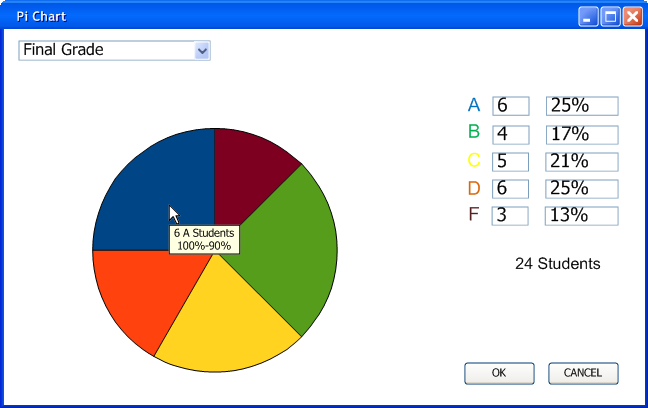
Figure 2.6.2c: Pie Chart while user hovers
Other assignments and categories are also viewable. The user selects the category or assignment from the drop down menu. Sub-categories are shown using arrows.
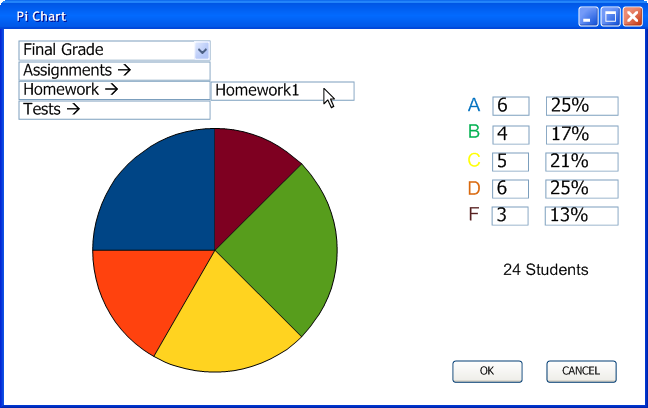
Figure 2.6.2d: Choosing display categories.
The grade scheme is also applied to these assignments, as shown in figure 2.6.2c.
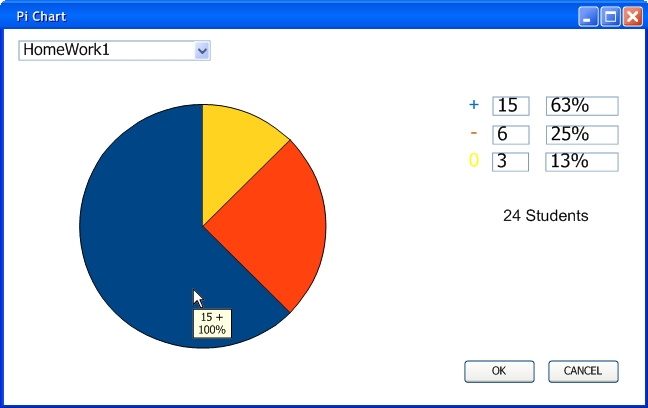
Figure 2.6.2e: Pie Chart a homework assignment using a grade scheme
When the user creates a new final grade scheme the pie chart will update to display this. For example if the user creates a +/- Final grade scheme it will be shown in the Pie chart.
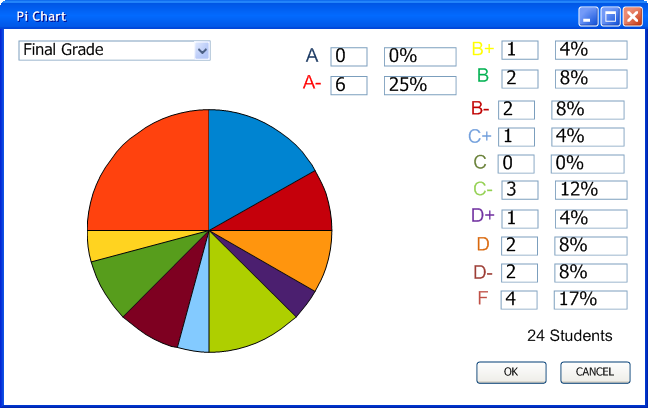
Figure 2.6.2f: Pie Chart showing a final grade scheme
In this example of pie chart manipulation a 5 letter grade scheme is shown for easy understanding. The user can alter the grade scheme by clicking and dragging the divisions between the pieces of pie.
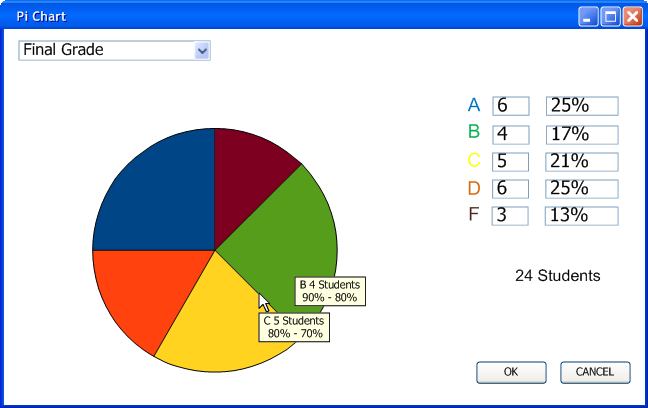
Figure 2.6.2g: Pie Chart while hovering over a line
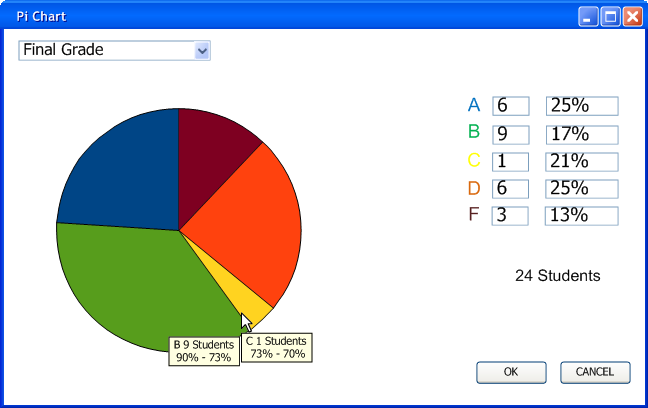
Figure 2.6.2h: Pie Chart after moving the line
The user can also collapse slices of the pie chart by dragging on slice's line into another slice.
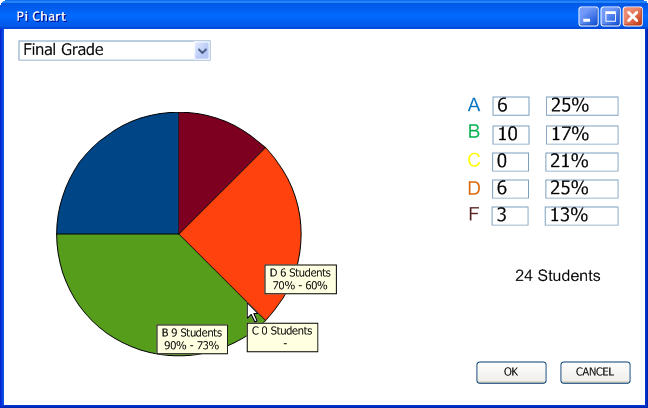
Figure 2.6.2i: Pie Chart showing collapsed grade
After the user presses ok, the final grade scheme saves and is viewable on the spreadsheet.
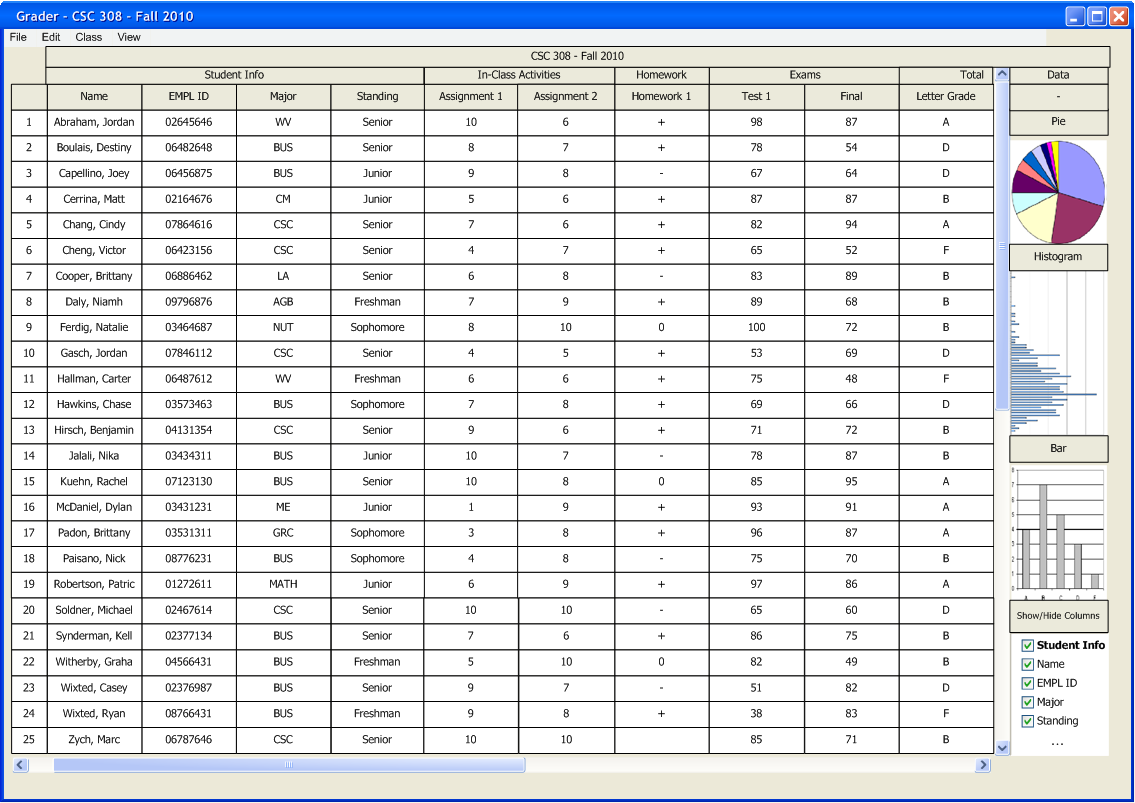
Figure 2.6.2j: Grades after manipulation