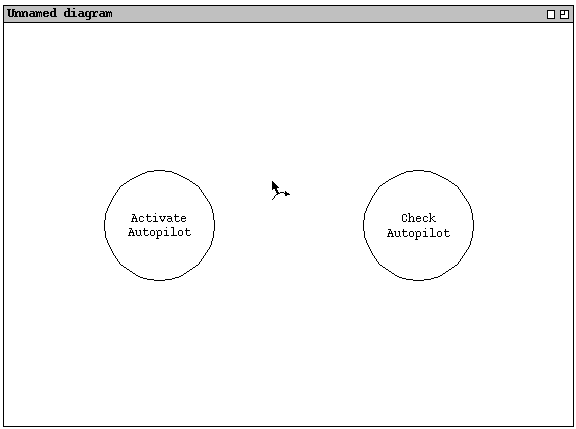
When the user selects the `Edge' command in the `Elements'
menu, the tool displays an edge-addition cursor under the current mouse
position on the dataflow canvas, as shown in Figure 7.
Figure 7: Adding a new edge.
To create an edge, the user starts by moving the mouse to an edge starting
position. This position must be on the boundary of a node, including on one of
its output ports. Whenever the user moves the mouse to a valid edge starting
position, the tool highlights the node by widening its boundary, as shown in
Figure 8.
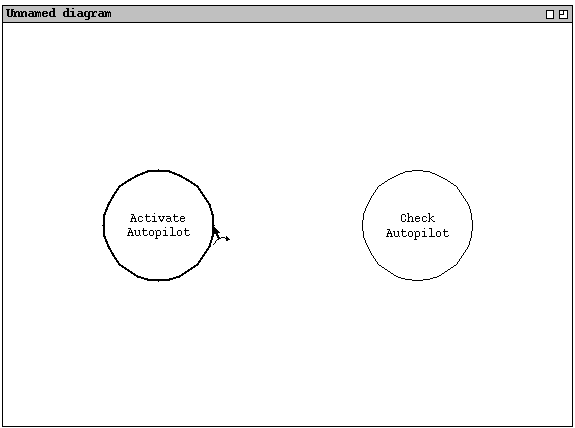
Figure 8: Edge cursor at valid starting position.
As the user moves the mouse, the tool tracks it with a line that extends from
the edge starting position to the current mouse position. During edge drawing,
the user is simply moving the mouse, with no button depressed. Figure 9
illustrates the user having dragged the edge cursor approximately halfway
between starting and ending positions on the "Activate Autopilot" and
"Check Autopilot" nodes.
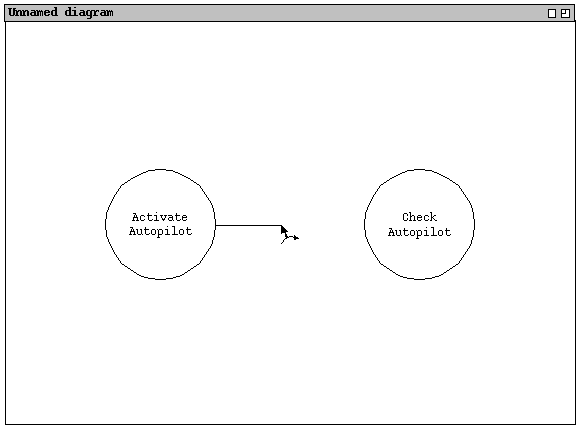
Figure 9: Edge cursor halfway between starting and ending positions.
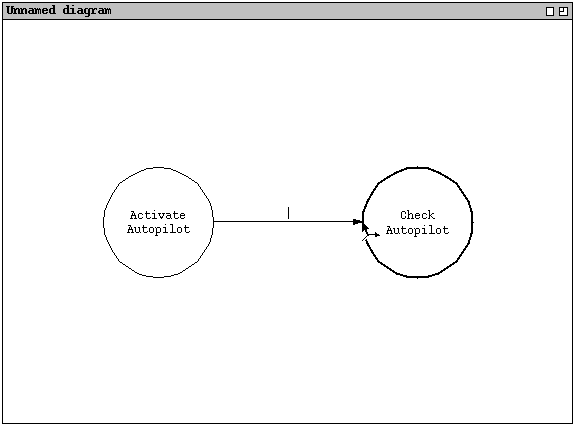
Figure 10: New edged placed on the canvas.
Finish details of labeling; there are some notes below.
The user can create three types of edges, based on the canvas locations of the starting and ending positions. The three types are defined in the following table:
| Start Position | End Position | Type of Edge |
| on a node | on a node | node-to-node connection |
| not on any node | on a node | external input |
| on a node | not on any node | external output |
A node-to-node connection defines an input/output relationship between the two nodes. An external input defines an edge that must have its value provided by an external source, rather than coming from another node. Similarly, an external output defines an edge whose output goes to an external source, rather than to another node. Further details on external data sources are covered in ???.
User may start anywhere within or at the boundary of an node. If the edge- drawing starts within a node, then the starting point of the finished edge is where the edge line intersects the boundary of the node. End point is similar. If the intersection point crosses any part of a port icon, then the edge is considered to be connected to that port (see below for more on ports and edges).
Details of label cursor placement: Tool puts text cursor in center of edge, with center defined as the position on the edge equal to 1/2 edge length, as measured along the edge spline. The background of the text is the current bg color, which is white by default. The text color is black by default. The background size is ... . As the user types, the center of the label text remains positioned on center of the edge.
The same type of completing for edge names is provided as for node names. Viz., the names of existing objects are available. If the typed text is not an existing object, than the dftool creates an opaque object of that name and adds it to the underlying fmsl spec.
The following forms of edges are illegal:
It is legal to connect a node to itself, i.e., have the input and output ends
of an edge be the same node. To do so graphically, the user must use a multi-
point edge.
2.3.1. Edges and Ports
Sketch:
| Start Point | End Point | Behavior |
| off port | off port | new output port created on starting node, new input port created on ending node; type of ports is object named by edge name entered by the user |
| on port | off port | new input port created on ending node; edge name is auto-filled with type of output port |
| off port | on port | new output port created on starting node; edge name is auto-filled with type of input port |
| on port | on port | type of ports must be the same; if so, edge name is auto-filled with that type |
The following roll-over behaviors assist with port connections:
Roll-over display details:
|
cartesian quadrant
of port connection | box placement corner |
| 1 | lower left |
| 2 | upper left |
| 3 | upper right |
| 4 | lower right |
During the mouse drag operation for an edge, the user may press the right mouse button to add graphic control points to the edge. A graphic control point allows edges to be shaped as curves, to aid in the visual appearance of the diagram. Formally, edges are drawn as b-spline curves, with each control point interpreted according to the standard definition of a b-spline.
Figure 11shows the result of the user drawing an edge by left clicking on the
boundary of the source node, right clicking at a middle point while drawing,
then left clicking on the boundary of the destination node.
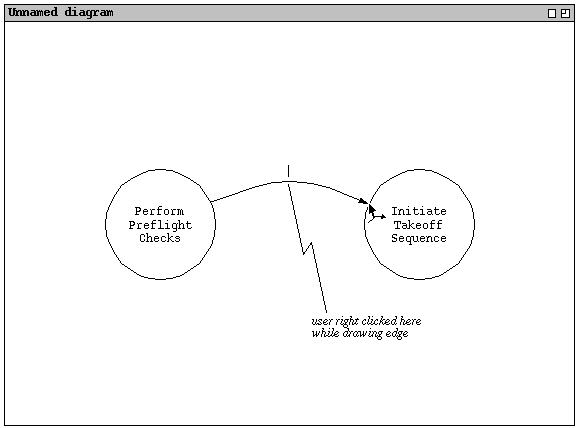
Figure 11: Drawing a curved edge.
Sketch:
When the user selects an edge, the dftool draws small "handles" on and around the line or curve for that edge. The handles are control points that the user can drag to reshape the edge.
If an edge is a single straight line, then there are two control points, one on each end of the line. If an edge is a curve, then in addition to the end control points, there are one or more additional control points that defined the curvature of the edge.
The user can click and drag on any edge handle to change its position on the screen, and thereby change the shape of the edge. When the user drags an edge end point the is connected to a node, the movement of the point is constrained to the circumference of the node to which it is attached. When user drags an edge control point that is not connected to a node, it may be moved to any location on the canvas except within a node.
To add or delete control points to an edge, the user selects the `Add Edge Point' and Delete Edge Point' commands in the `Edit' menu. Short cuts for these commands are to hold down shift and move the most onto an edge or one of its handles.
To add a new control point, the user selects `Add Edge Point' (or
holds the shift key) and moves the mouse to a place on an edge that does not
have control-point handle. In response, dftool augments the mouse
pointing cursor with a small plus sign, indicating that the user can click at
that point to add a new control point. To remove an existing control point,
the user selects `Delete Edge Point' (or holds the shift key) and
moves the mouse to the control to be deleted. In response, dftool
augments the cursor with a small minus sign, indicating that the user can click
to delete that control point. The three states of the mouse cursor adding or
deleting an edge point are illustrated in Figure 12.
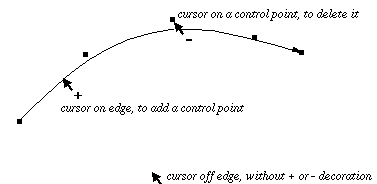
Figure 12: Mouse cursor while adding and deleting edge control points.
Notes on label editing, to be more fully elaborated: