Braden Becks CPE 471 graphics final project Winter 2016
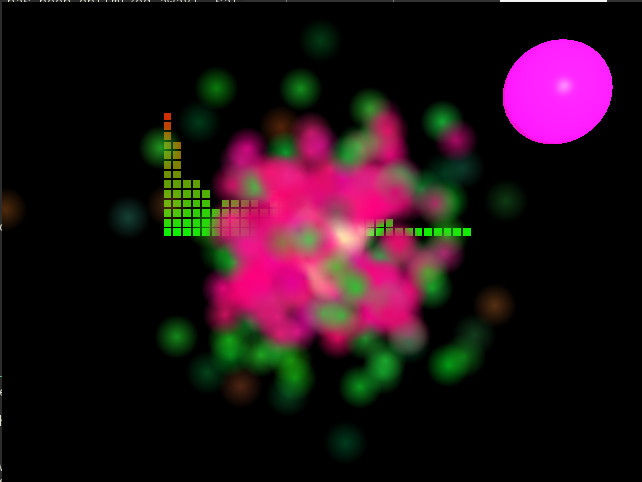
For my final project I created a music visualizer. I was inspired by all the cool visualizers winamp has, And the fft visualizer ncmpcpp has. So the end result looks like a visualizer you might see if winamp decided to make a linux cli based music player, or if ncmpcpp decided to make a graphical interface. It contains a visualized fft which is represented by squares a sphere whose size, velocity, and color is based on the audio, and particles, whose size color and velocity is also based on the audio. Here's a picture:
Running with 1 audio file
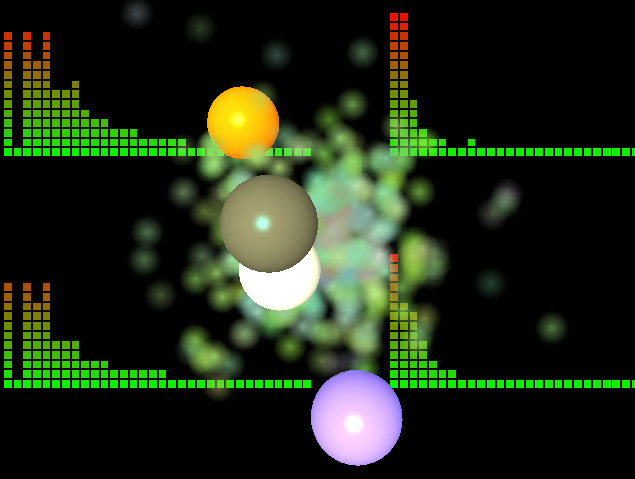
But that's not all! Lately I've had a habit of listening to strange music, so I decided to make the visualizer be able to work for up to 4 wav files so that I could visualize the flaming lips 4cd album Zaireeka. This album is meant to be listened to on four simultaneously on 4 different sound systems. So the visualizer supports running 4 tracks at once so I could visualize the differences in the tracks on this album. Here's what the end result looked like.
Running with 4 audio files
Of course pictures don't really do it justice check out the demo videos, they are low quality but will give you the general idea. To truly experience this you must run the program yourself, see the readme for how to do so.
Graphics Technologies
I used one library and one system resource (aside from opengl) to accomplish this.
The system resource I used was libcanberra, specifically I used the program canberra-gtk-play available with this library to play the audio files on the host operating system. I did this by creating new threads and having them call system(canberra-gtk-play -f filename.wav), So the audio is only confirmed to work on linux.
The library I used was called aquila. It was originally created to analyze bird calls so it does not have any methods for actually playing sound (which is why I had to play the audio in another thread). Aside from that it is a pretty competent library for analyzing sound, but it does work in some strange ways.
There was a lot of computation involved in this project and I'll try to give you an overview of all the steps involved.
First of course I had to create a new thread for each audio file to play the music. Then I sent the audio files to aquila and preformed manual computation to get the range of values of samples so that I could precompute averages, maxes, and mins to make the scaling on the balls and particles react reasonably to the audio (since I scale them given the context of the averages, maxes, and mins of the whole audio file).
After all this precomputation I have vectors representing the audio files along with vectors contain the precomputed max and min information. From here I programmaticly call a render function that goes though each audio file and grabs a vector of audio samples based on the time since the audio was started and the number of samples per millisecond. This allows me to concurrently run the music and the visualizer since the samples that are analyzed are based on the time that has passed since the music started using the precomputed length of the song and number of milliseconds per sample.
Once I have created a vector of audio samples I run computations on those samples. In particular I use aquilia to get the power (energy, volume, call it what you will) of the audio segment encompassed by those samples and scale the balls and particles based on that power and the precomputed averages. Such that loud parts of the audio will produce higher scales and soft parts will produce lower scales. I also use this to generate a depiction of the tempo of the music by scaling the movement of the balls and particles by this same scale. This creates an effect where the balls and particles seem to dance with the music. To liven things up a little I made the balls move in random directors within a bounding box so that they appear to bounce all over the screen to the music.
Next I used aquila to generate a discrete Fourier transform to get information about the frequency domain of the audio samples I consider at each step. After getting aquila to produce this using the Fast Fourier Transform algorithm (this Wikipedia article was really helpful) I used the frequency information to generate a sort of wave much like the fft visualizer ncmpcpp has. To do this I created an array to represent the audio levels at different frequencies. After generating that I translated this into graphics by picking a range in which to draw the fft and creating a base of squares where each one represents a certain frequency range. From here I looked at each range and went up through the drawing range and put a square in the position where the frequency was greater than or equal to the space in the y in the drawing range mapped to the frequency range, such that large frequencies made squares be drawn in higher places relative to the base, I also made the colors vary on the y axis to make it look more like the ncmpcpp visualizer. To get this to look right I had to normalize and average a lot of the frequency input by averaging over the sample size and limiting the frequencies I actually used. The end result looks pretty good though.
In the end this was a fun and informative project and if you like music as much as I do I highly recommend embarking on a similar endeavor, you may want to find a better audio library, though I grew to love aquila for all its quirks.
Demos
Running with 4 audio files
A
Song: "Okay I'll Admit That I Really Don't Understand - The Flaming Lips"
Running with 1 audio files
Song: "Feel It All Around - Washed Out"
Running with 4 audio files
Song: "Riding to Work in the Year 2025 (Your Invisible Now)- The Flaming Lips"