|
|
| Overview Procedure Pictures Improvements References | |
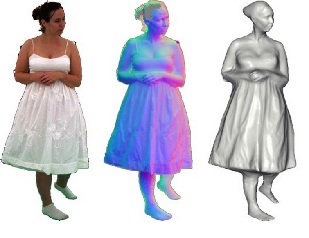
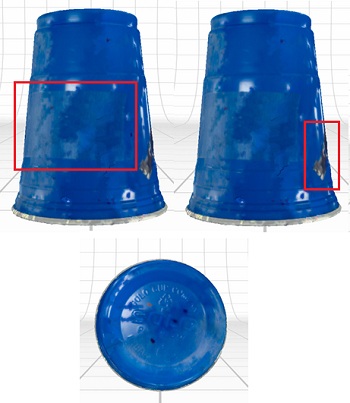
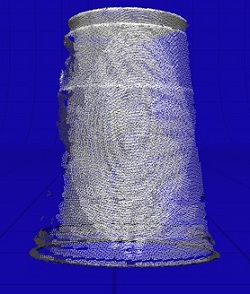
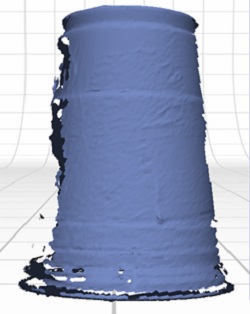
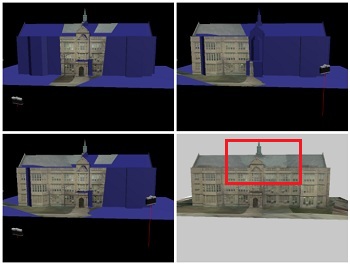
PicturesThe image above is an excellent example of the problems of laser imaging. The laser does an excellent job of capturing the general shape of the object but misses quite a bit of data in areas such as under the dress and where the arms touch the dress. The program(s) used to fix the holes in the data can sometimes make the problem worse by adding an excess of data in incorrect places to patch the holes. This results in the lack of distinction between her fingers as well as the blending of the arms into the dress. One improvement to this issue without collecting significantly more data would be to take two or three different orientations of scans of troublesome locations such as the dress or the arms to make the final product look finished but without the need of replicating data that was already good. This solution requires a bit more human intervention and depending on the situation, the above figure resolution may be all that is necessary. Depth ResolutionThe two combined sets of scans placed together illustrating the resolution of the laser scanner is shown above from two angles. Note the image on the left and the red box. The barely visible light blue area is actually a blue piece of painters tape that I put on the cup to show the contrast between the duct tape and painters tape in terms of reflectivity. Something I found interesting that I did not expect was the lack of resolution on the depth of the tape; without knowing the painters tape was there I doubt anyone looking at the snapshot would be able to identify there was even something on the cup to begin with. I attribute this error to the lack of depth to the tape. Although the tape is very thin ~1mm, this slight change in depth allows our eyes to easily give an outline of the shape and boundaries of the tape; however, the laser scanner does not have the resolution capabilities that would allow a clear and distinct difference in height between the tape and the cup. This small difference between the laser scanner and our eyes make a big difference in many applications involving minute surface detail such as the bottom of the cup shown on the far right. Point CloudPoint cloud representation of 4/10 scans meshed together (of a set of 10 scans) illustrating the density of the data points. On the far left of the cup you can see the holes that will eventually be patched when the remaining 6 scans will be completed. This image is also a great visual aid to the density of the collected data points. This is a great way to determine which configuration of the object will give the highest density of data points (not always necessary but is useful when TriangulationTriangulation of the point cloud showing the concentration of data points where the normals of the surface face the laser receiver/transmitter. On the right and left of the cup there are holes between each of the triangulated groups illustrating a smaller density of points relative to the center where the points are clearly more dense. LightingAnother example showing the discoloration of the overlapping of scans due to the differences of lighting in the individual scans. |
     |
| Design by Svetainių kūrimas | |