This scenario shows the user how to view at-a-glance statistics in the spreadsheet. It displays the mean, median, standard deviation, range, and number of graded item submission for each graded item. For this scenario, the data will be taken from Section 2.4.3..
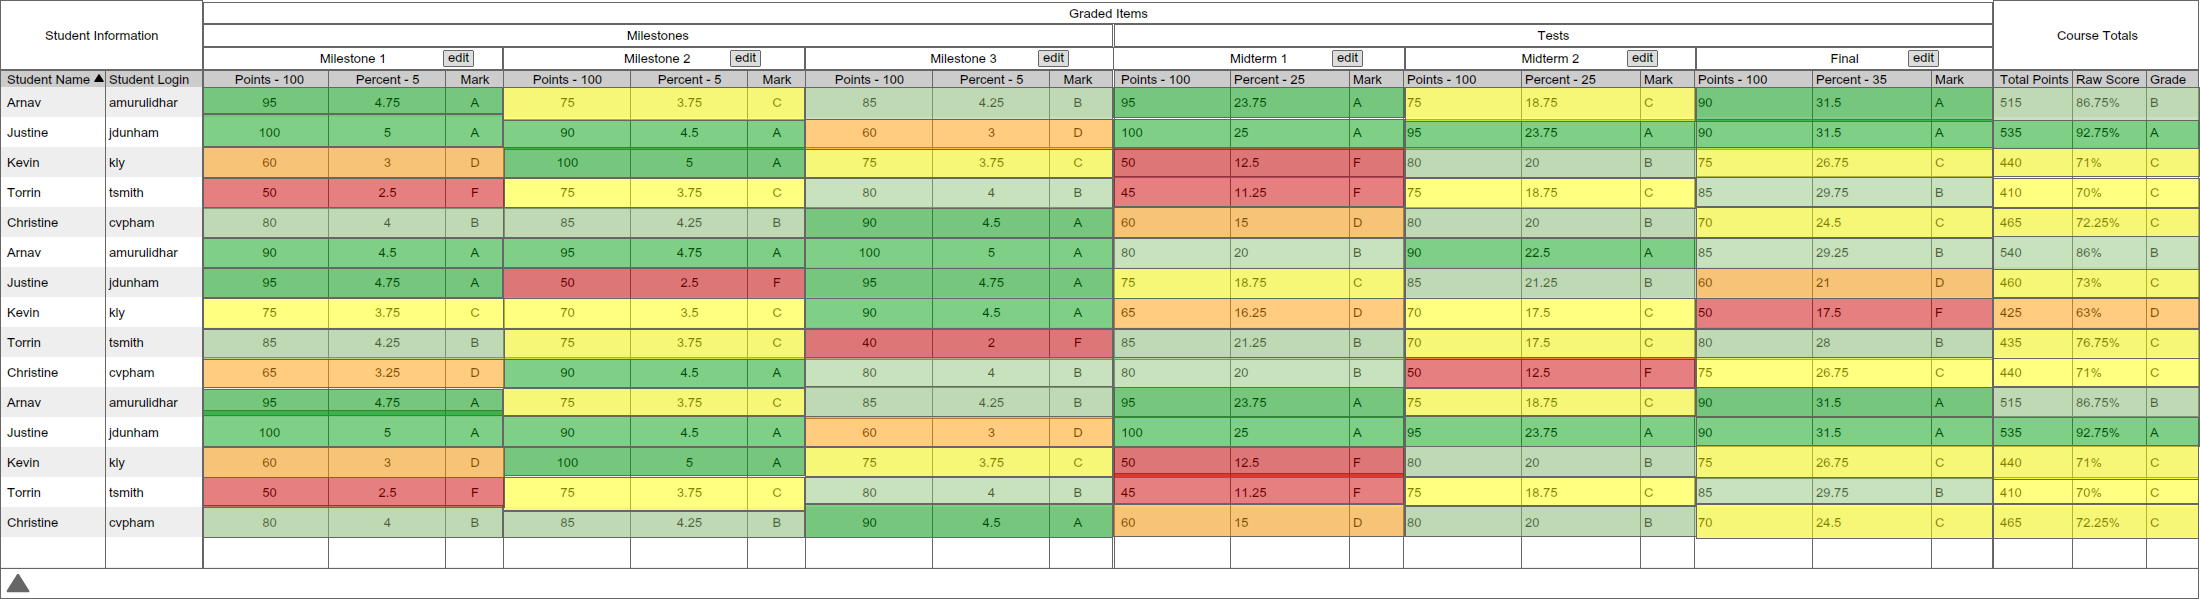
The statistics bar is toggled as a drawer on the bottom of the spreadsheet. It
it either shown or hidden, and can be accessed by the triangle on the bottom of
the spreadsheet as shown in Figure 1.
Figure 1: Main Spreadsheet.
Upon clicking on the triangle, a drawer will appear displaying 5 rows. The rows are mean, median, s.d. (standard deviation), range, and count. The mean calculates the mathematical average by summing each graded item's score in that column, then dividing it by the number of submissions. The median is the score which half of the submissions scored under it, and the other half scored above it. The s.d. is the statistical standard deviation of all the scores of that column. It is a measure of spread. range gives the minimum and maximum score of that graded item. count is the number of submissions for that graded item. A sample is displayed in Figure 2.
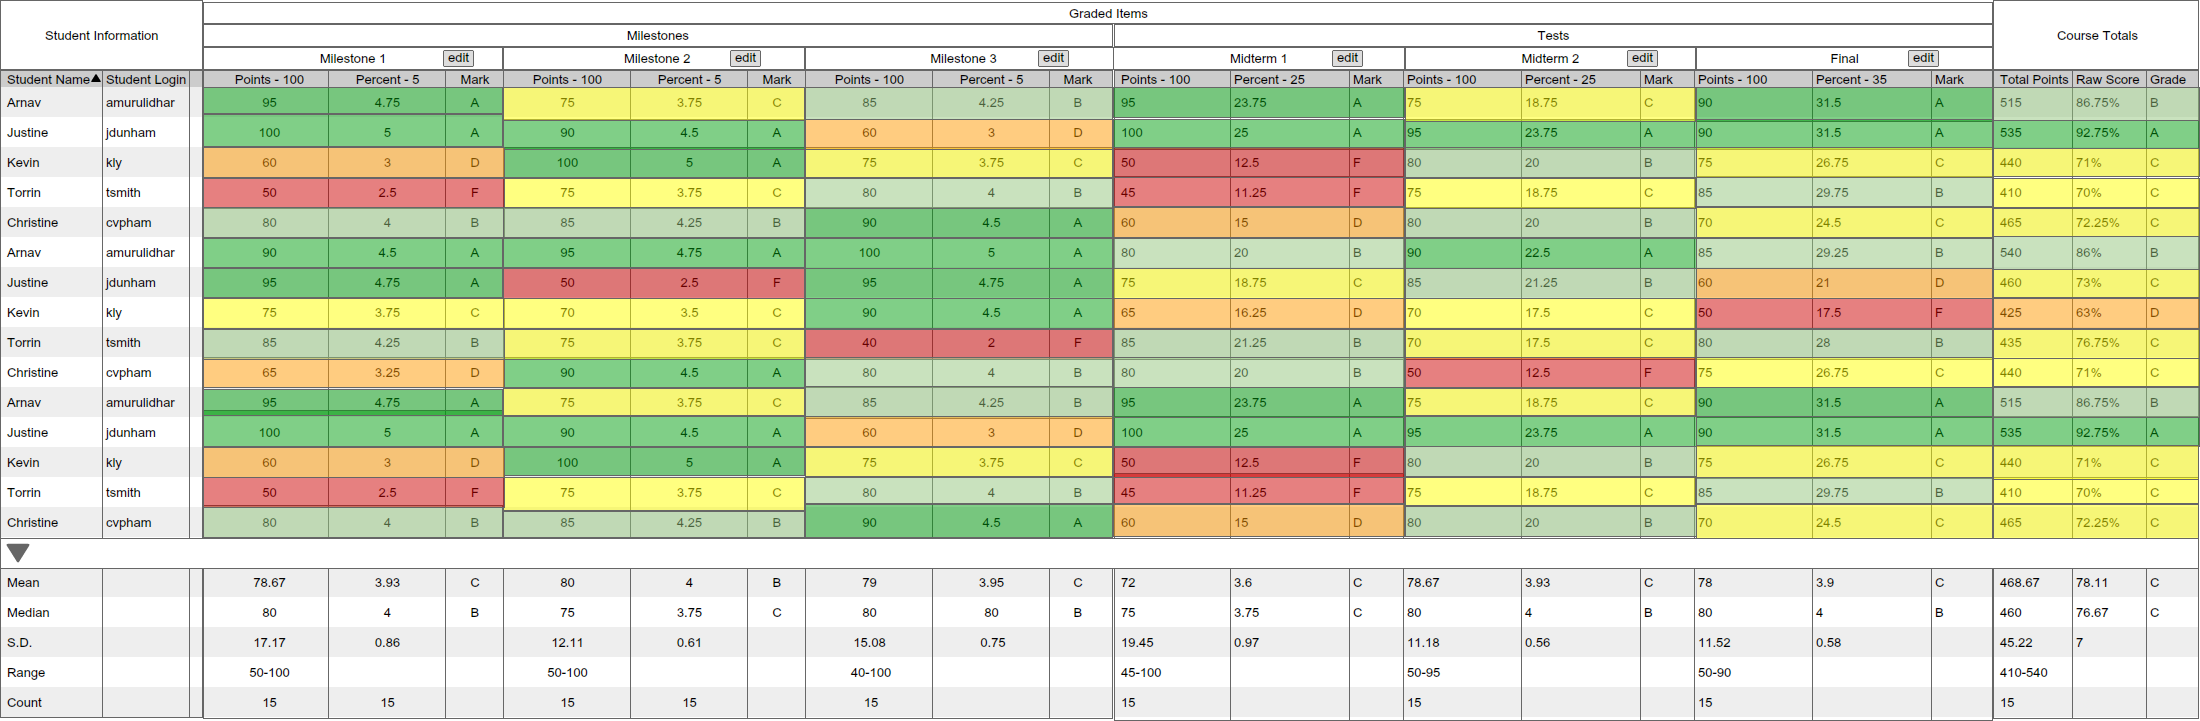
Figure 2: Statistics Bar.
As such, the 5 rows compute its value using the scores in that column. The final 3 columns, Total Points, Raw Score, and Grade gives a statistical overview of the entire class.
To close the drawer, simply click on the triangle again.