Scenarios in this section illustrate instructor tools that are used
to view and and analyze test results. At this screen, instructors can
view the results of tests that have been completed. Here they can see statistics about
the class's performance as a whole, or they can view the results of individual students
if they would like.
2.8.1. Selecting a Test to View
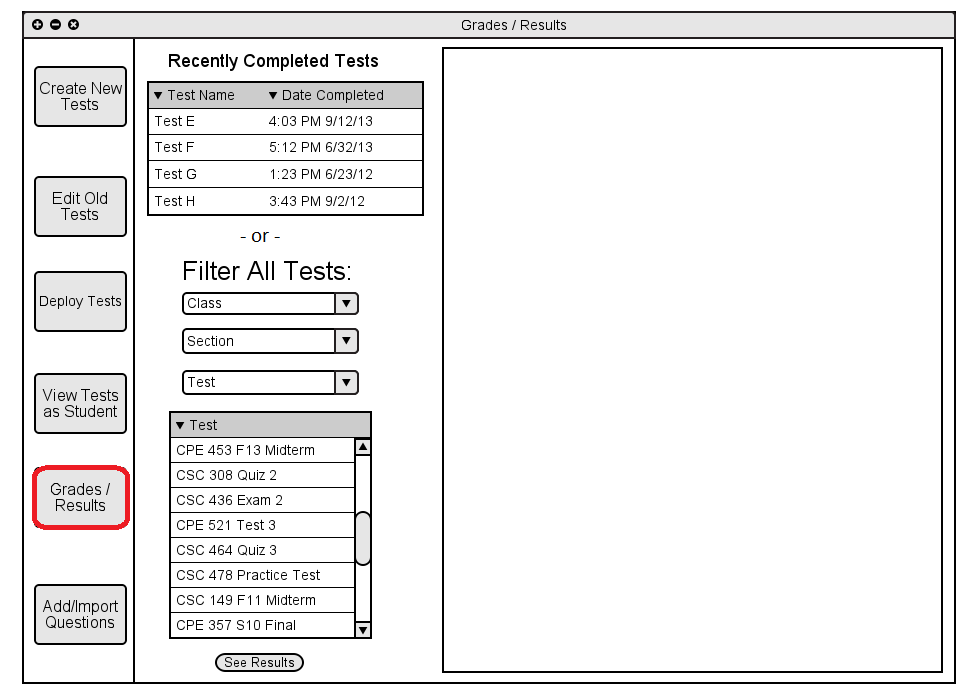
Tests can be selected in two different ways. The first option is via the "Recently Completed Tests".
A list of the most recently completed tests can be found in an auto-populated grid of selectable tests.
After selecting a row, users can either double click with a mouse or press the "See Results Button".
If an instructor wants to view a test that isn't in this list, however, they can also utilize
the filtering system. By narrowing the scope of the tests, all of which are found underneath the three
filters, instructors can narrow down the results until they find the test they are looking for.
The instructor user would then click the "See Results" button, which brings up the inset screen
found in Figure 2.

Figure 1: Initial Grades / Results Screen
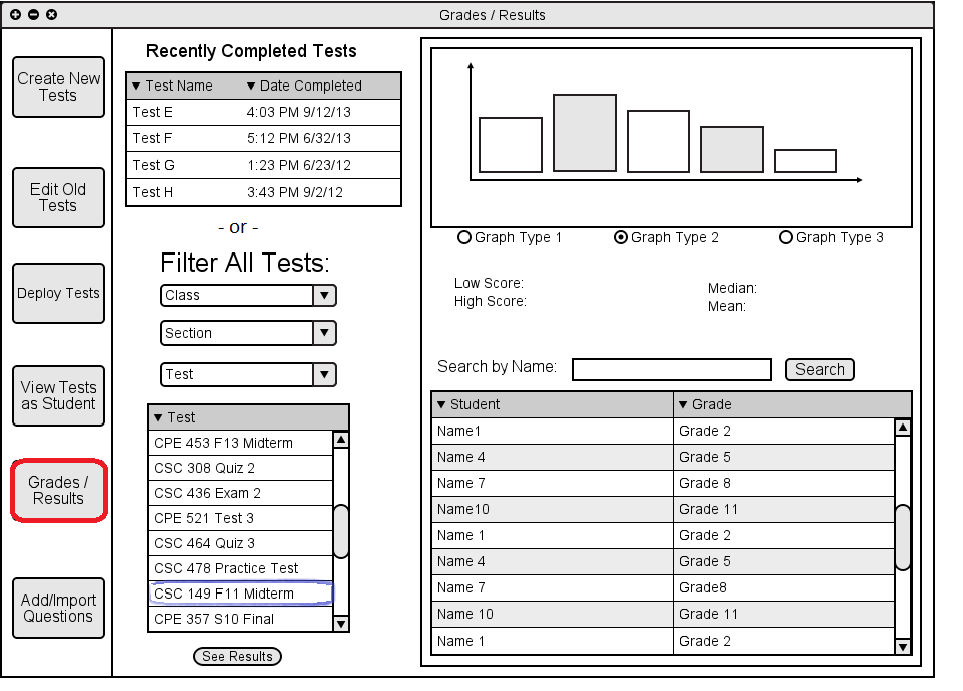
Once the "See Results" button is pressed, the following menu is displayed.

Figure 2: Results Displayed.
The user is next presented with the results of the selected test. On the top of
this window, instructors can choose between various graph types to to see visual
representations of the results for the test. In the middle section, users are presented
with a quick summary of statistics, so that they can quickly see commonly calculated values,
such as the average test score.