2.4.2 Statistics
In this walkthrough, a user has already added students, assignments and wants to view the class grade statistics. The statistics for the class are calculated on the fly as soon as any change has been made to the grade sheet. To view the statistics, click the View >> Statistics menu on the main screen.
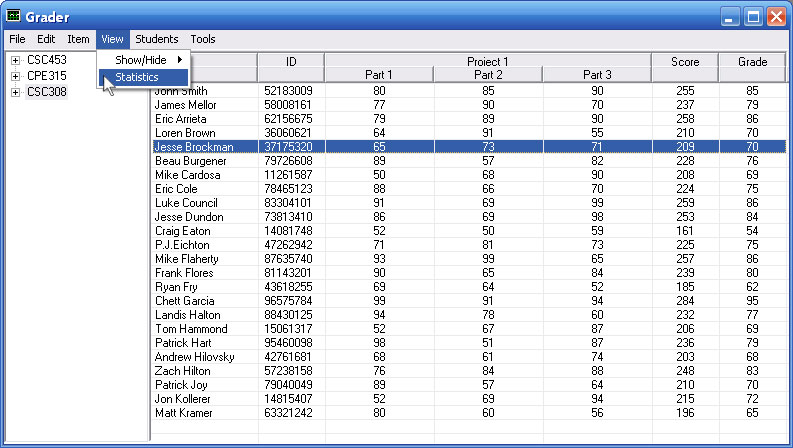
Figure 2.4.2.1
Figure 2.4.2.1 shows the Grader tool before clicking on the Statistics menu item.
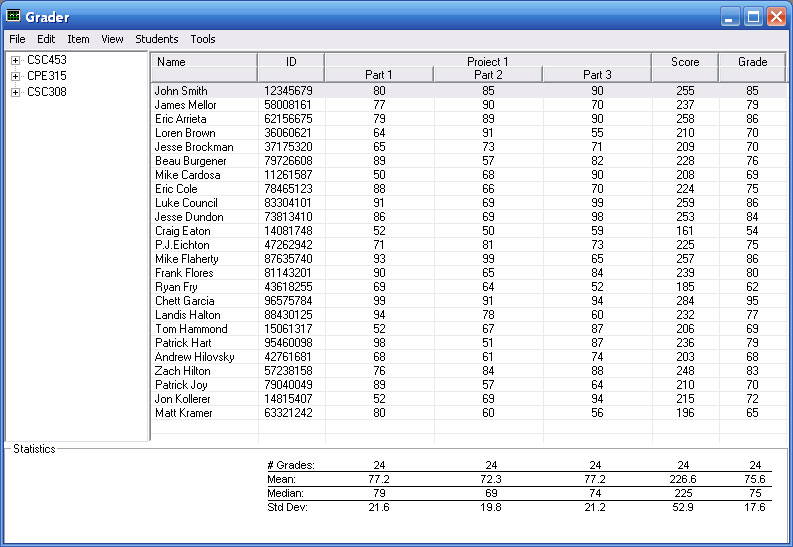
Figure 2.4.2.2
Figure 2.4.2.2 shows the Grader tool after clicking on the Statistics menu item. For every column that has a score there are statistics under it. The # Grades represents the number of actual grades turned in for that assigment. If 4 students did not turn in Part 1 of Project 1, the screen would look like Figure 2.4.2.3. Notice the # Grades item has changed to 20 from 24.
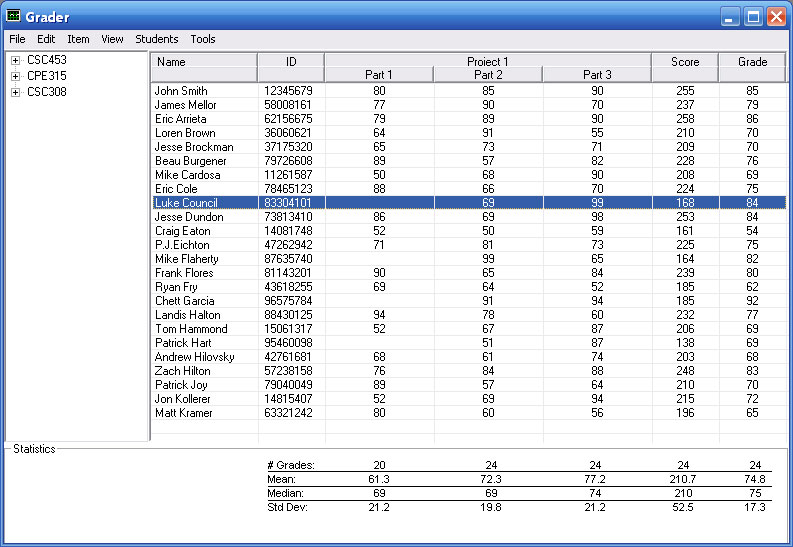
Figure 2.4.2.3
The Std Dev item represents the standard of deviation for that column. The same goes for Median and Mean, they represent the Median and Mean for the column above them.
Prev: Item Explorer
| Next: Expand/Collapse
| Up: 2.5 Viewing Details
| Top: index