2.6.2 Histogram
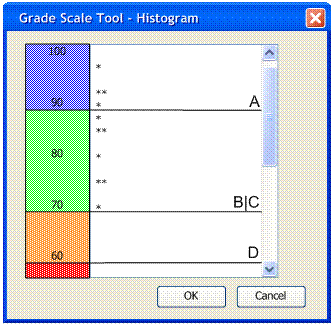
The histogram works largely the same way as the pie chart. The total
percentage of each student is plotted on the histogram. The dividers are then
placed, defining the grade distribution as shown in figure 2.6.2-1. The dividers
then can be dragged just like the pie chart with similar behavior.
Figure 2.6.2-1 displays a situation where the divider between a B and a C has been moved to overlap with the divider that lies between a C and a D. At this point, the instructor can click on the C tab between B and D and drag it to create a new region corresponding to a C.

Figure 2.6.2-1
Prev: Piechart
| Next: Table |
Up: Functional
Requirements | Top: index