2.6.3 Table
The table functionality of the grade scale tool has two tables: one table
for absolute percentage grade distribution and another for relative percentage
distribution. The instructor must choose which table will determine the grade distribution
using the checkbox.
The absolute percentage table has a column for each possible grade. The
displayed percentage for a given column indicates the maximum grade possible to
receive that grade. For example, in Figure 2.6.3-1, the highest percentage that
would receive a C would be 79%.
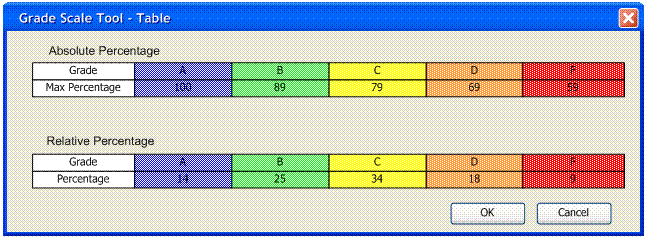
Figure 2.6.3-1
If a value higher than the maximum percentage of a grade immediately above
is entered for the maximum percentage is entered, an error message box will be
displayed and the input will be disregarded. In the same way, entering in a
percentage lower than the maximum of a grade immediately below is entered, an
error message box will be displayed and the input will be disregarded. A
percentage equivalent to the maximum percentage of a grade immediately above or
immediately below is allowed.
Once the data is entered, the other charts and graphs are modified to
reflect the new grade distribution.
The relative percentage table also has a column entry for each possible
grade. The relative grade distribution table
requires that the instructor enter in the percentage of students receiving the
grade for each grade at once. Once the grades are entered, the new grade
distribution is reflected on other charts and graphs.
In Figure 2.6.3-2 the grade scale has been changed so that 20 percent of
the class receives each grade. The
absolute percentages have been modified to accommodate the new grade scale.
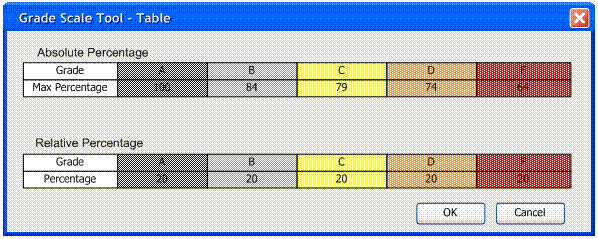
Figure 2.6.3-2
Prev: Histogram | Next: Predicting Grades | Up: Functional Requirements | Top:
index