2.8.
Viewing Grades
This scenario assumes that a gradebook has already been
opened and updated to the latest revision from an internet source like
hornet.calpoly.edu.
By default, the user has a detailed view of homework, test,
midterms, or quiz grades. But, for different statistical view the user
highlights the ‘Student Name’ then select ‘View Grades’
under
‘Tools’.
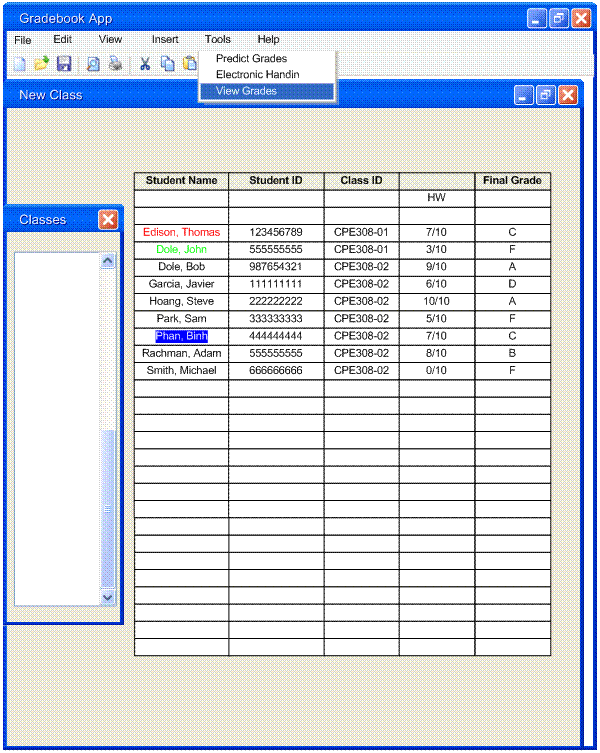
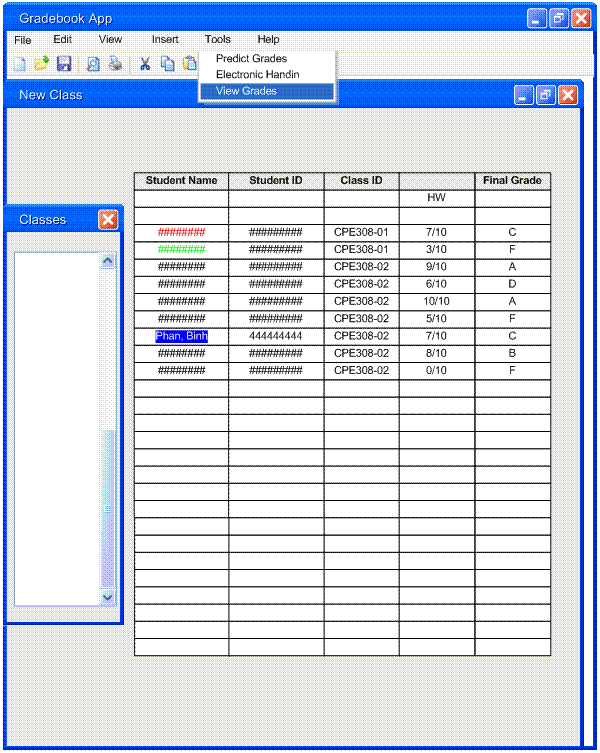
Figure
2.8-1 : View Grades: Instructor or TA view (left) and Student view
(right).
In response, the
user will see 3 different grade views scaled down: tabular, histogram, and pie
chart view.
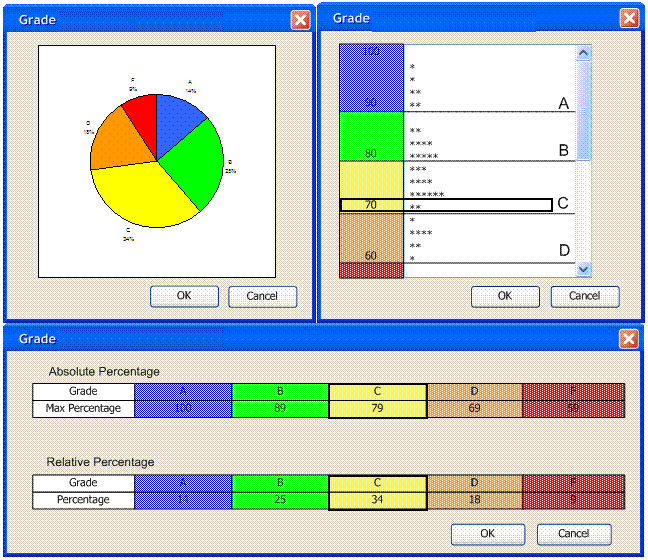
Figure 2.8-2 : View Grades: Piechart (top left), Histogram
(top right), Tabular (bottom).
The view looks almost exactly like seen in “Grade Prediction” but the main difference
is it not user interactive and it focus more on a particular grade. In the
example above, the histogram and tabular windows draw outlines in black for
data relevant to student ‘Phan, Binh’.
Prev: predicting grades | Next: hand in | Up: functional | Top:
index